. 2018 Aug;209(4):1029-1042.
doi: 10.1534/genetics.118.301237. Epub 2018 Jun 15.

Determinants of Base-Pair Substitution Patterns Revealed by Whole-Genome Sequencing of DNA Mismatch Repair Defective Escherichia coli

Affiliations

Determinants of Base-Pair Substitution Patterns Revealed by Whole-Genome Sequencing of DNA Mismatch Repair Defective Escherichia coli

Patricia L Foster et al. Genetics. 2018 Aug.

Abstract

Mismatch repair (MMR) is a major contributor to replication fidelity, but its impact varies with sequence context and the nature of the mismatch. Mutation accumulation experiments followed by whole-genome sequencing of MMR-defective Escherichia coli strains yielded ≈30,000 base-pair substitutions (BPSs), revealing mutational patterns across the entire chromosome. The BPS spectrum was dominated by A:T to G:C transitions, which occurred predominantly at the center base of 5'NAC3'+5'GTN3' triplets. Surprisingly, growth on minimal medium or at low temperature attenuated these mutations. Mononucleotide runs were also hotspots for BPSs, and the rate at which these occurred increased with run length. Comparison with ≈2000 BPSs accumulated in MMR-proficient strains revealed that both kinds of hotspots appeared in the wild-type spectrum and so are likely to be sites of frequent replication errors. In MMR-defective strains transitions were strand biased, occurring twice as often when A and C rather than T and G were on the lagging-strand template. Loss of nucleotide diphosphate kinase increases the cellular concentration of dCTP, which resulted in increased rates of mutations due to misinsertion of C opposite A and T. In an mmr ndk double mutant strain, these mutations were more frequent when the template A and T were on the leading strand, suggesting that lagging-strand synthesis was more error-prone, or less well corrected by proofreading, than was leading strand synthesis.

Keywords: DNA polymerase fidelity; DNA replication accuracy; mismatch repair; mutation accumulation; mutation hotspots.


Figures

Figure 1
Figure 1
All MMR-defective strains have the same mutational spectrum but uvrD mutant strains have a lower mutation rate. (A and B) The data for all MA experiments with strains with the same MMR defect have been combined (see Materials and Methods); the number of experiments with each are: mutL, three; mutS, three; mutH, one; mutLS, one; mutLSH, two. The results of each MA experiment are given in Tables S3, S4, and S5. (C and D) The data from the 10 MA experiments with strains defective for mutL, mutS, and mutH are combined to give the results labeled MMR (see Materials and Methods). Bars represent the means and error bars are 95% CL for both rates and fractions. BPS, basepair substitution; Nt, nucleotide.
Figure 2
Figure 2
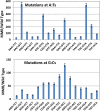
Base-pair substitution rates are influenced by the local sequence context. The data from the 10 MA experiments with MMR-defective strains (A and B) and eight MA experiments with MMR-competent strains (C and D) are combined to give the results labeled MMR and Wild Type (see Materials and Methods). The X-axis labels are the 32 sets of nonredundant triplets read 5′ to 3′ with the target base in the center of each triplet. Bars represent the mean BPS rates at each triplet; error bars are 95% CLs. Note the change in scale in the MMR charts between the BPS at A:Ts (A) and at G:Cs (B).
Figure 3
Figure 3
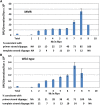
Mononucleotide runs are hotspots for BPSs in both MMR-defective (A) and MMR-proficient (B) strains. Bars represent the mean BPS rates per generation at basepairs adjacent to or within a mononucleotide run divided by the number of runs of each length in the genome. For BPS not associated with runs (i.e., nt in run = 1) the BPS rate per generation was divided by the total number of nucleotides in the genome minus the nucleotides in runs. Total = all BPS/generation divided by all nucleotides in the genome. Percentages are the number of BPS that are consistent with either primer or template strand slippage divided by the total number of BPS that occurred associated with runs of each length, ×100. The data are from the 10 MA experiments with MMR-defective strains (A) and eight MA experiments with MMR-competent strains (B). Nt, nucleotide; NA, not applicable. Error bars are 95% CL.
Figure 4
Figure 4
The DNA-strand bias of transition mutations varies strongly with sequence context in MMR-defective strains, but weakly in MMR-proficient strains. Bars represent the mean rates of transitions accumulated in 10 experiments with MMR-defective strains (A and B) and eight experiments with MMR-proficient strains (C and D) (see Materials and Methods). Mutation rates per generation at each triplet were divided by the number of that triplet in the genome. Error bars are 95% CLs. The X-axis labels are the 32 sets of nonredundant triplets read 5′ to 3′ with the target base in the center of each triplet. Note the change in scale in the MMR charts between the transitions at A:Ts (A) and at G:C (B). LGST, the target purine as displayed was on the lagging strand template; LDST, the target purine as displayed was on the leading strand template.
Figure 5
Figure 5
The efficiency of MMR is influenced by the local sequence context. Bars represent the mean ratio of mutation rates at each triplet in MMR defective vs. MMR proficient strains. Error bars are 95%CL calculated for the ratio. The X-axis labels are the 32 sets of nonredundant triplets read 5′ to 3′ with the target base in the center of each triplet. Note the change in scale between the results of mutations at A:Ts and at G:C.

Similar articles

Cited by

References

    1. Alseth I., Dalhus B., Bjoras M., 2014. Inosine in DNA and RNA. Curr. Opin. Genet. Dev. 26: 116–123. 10.1016/j.gde.2014.07.008 - DOI - PubMed
    1. Bebenek K., Joyce C. M., Fitzgerald M. P., Kunkel T. A., 1990. The fidelity of DNA synthesis catalyzed by derivatives of Escherichia coli DNA polymerase I. J. Biol. Chem. 265: 13878–13887. - PubMed
    1. Benzer S., 1961. On the topography of the genetic fine structure. Proc. Natl. Acad. Sci. USA 47: 403–415. - PMC - PubMed
    1. Bhagwat A. S., Hao W., Townes J. P., Lee H., Tang H., et al. , 2016. Strand-biased cytosine deamination at the replication fork causes cytosine to thymine mutations in Escherichia coli. Proc. Natl. Acad. Sci. USA 113: 2176–2181. 10.1073/pnas.1522325113 - DOI - PMC - PubMed
    1. Bloom L. B., Otto M. R., Eritja R., Reha-Krantz L. J., Goodman M. F., et al. , 1994. Pre-steady-state kinetic analysis of sequence-dependent nucleotide excision by the 3′-exonuclease activity of bacteriophage T4 DNA polymerase. Biochemistry 33: 7576–7586. - PubMed

Publication types