. 2018 Jul 11;38(28):6267-6282.
doi: 10.1523/JNEUROSCI.0515-18.2018. Epub 2018 Jun 15.

Reorganization of Destabilized Nodes of Ranvier in β IV Spectrin Mutants Uncovers Critical Timelines for Nodal Restoration and Prevention of Motor Paresis

Affiliations

Reorganization of Destabilized Nodes of Ranvier in β IV Spectrin Mutants Uncovers Critical Timelines for Nodal Restoration and Prevention of Motor Paresis

Julia Saifetiarova et al. J Neurosci. .

Abstract

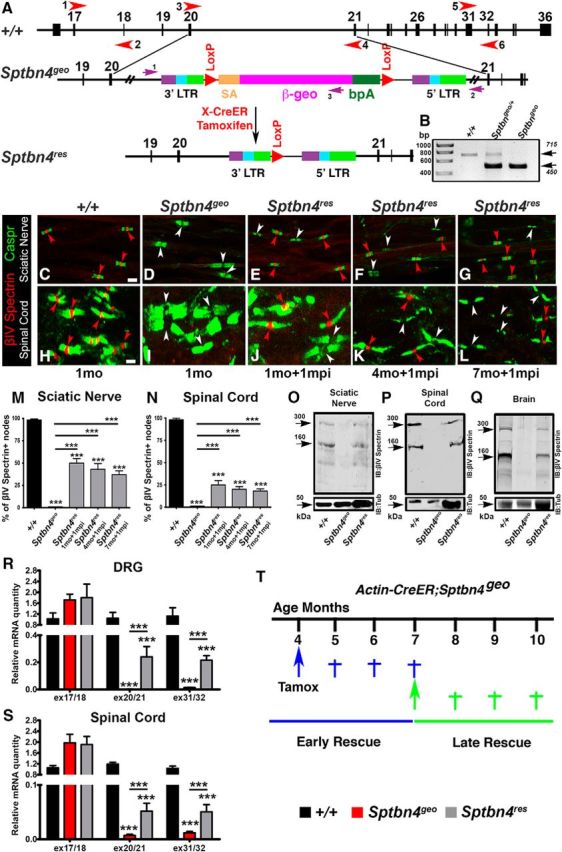
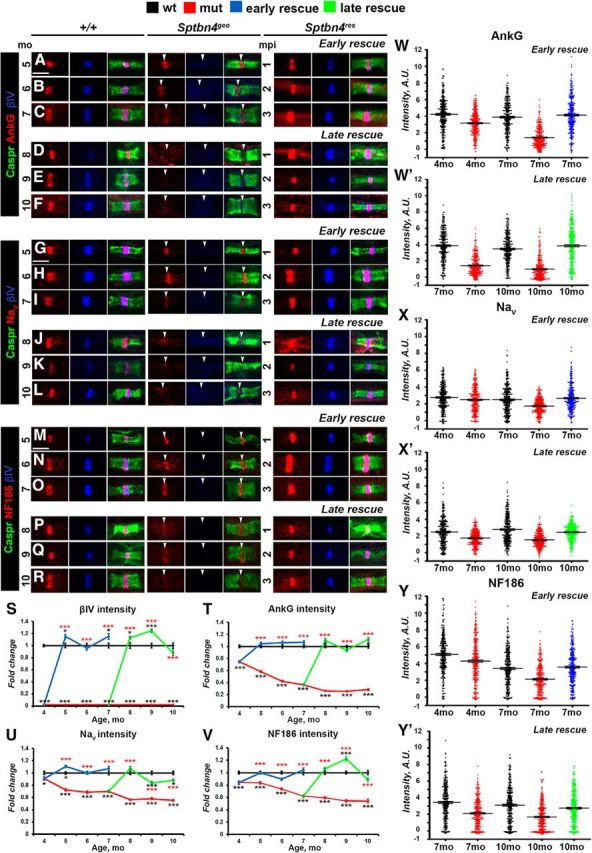
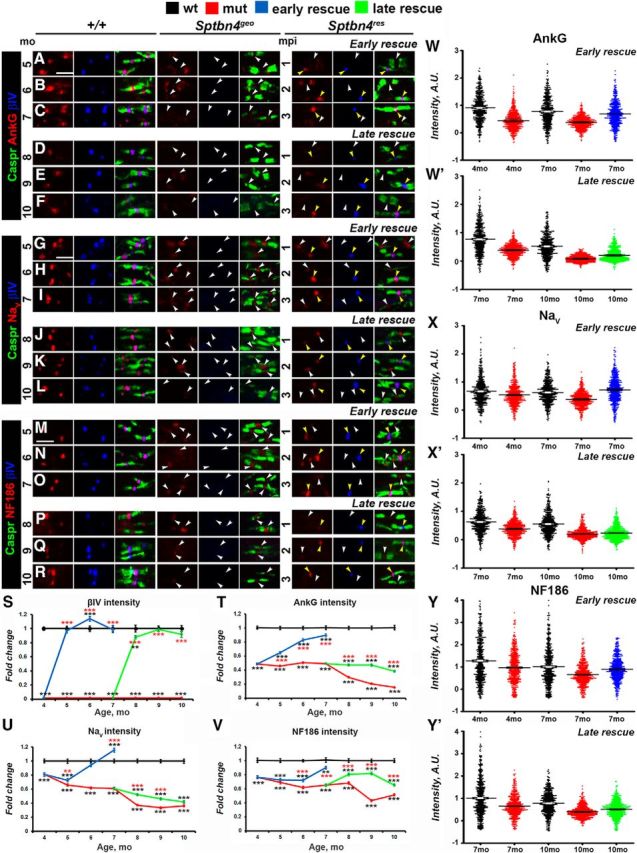
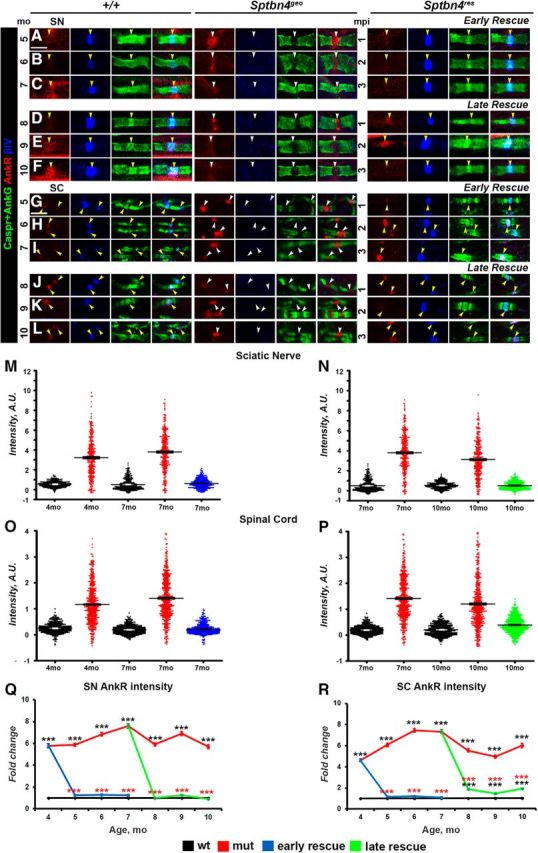
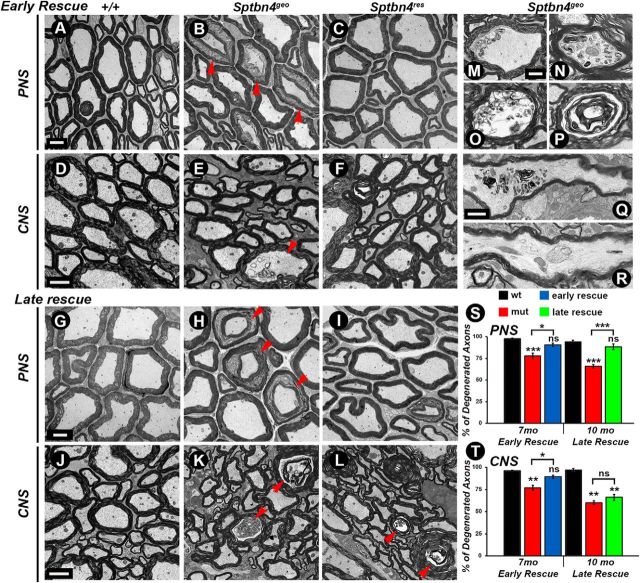
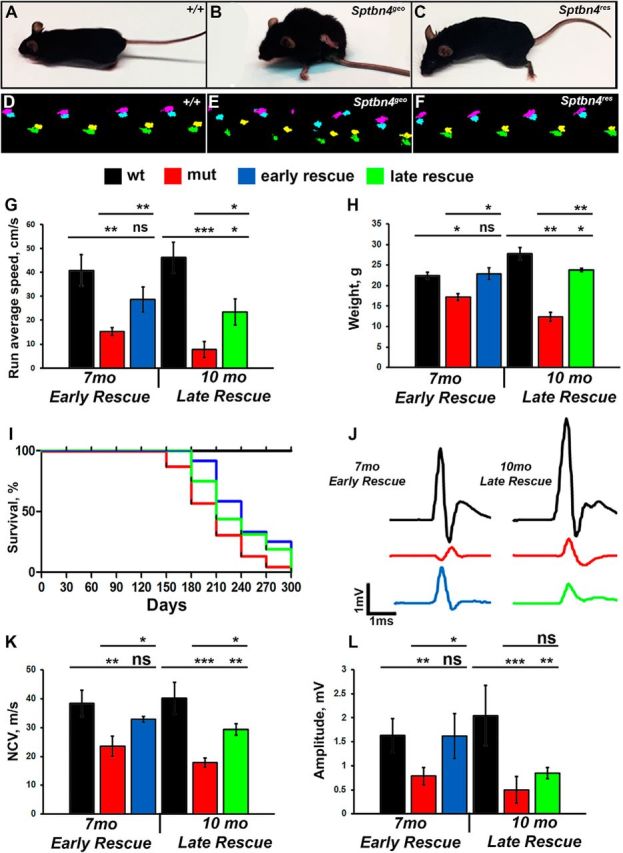
Disorganization of nodes of Ranvier is associated with motor and sensory dysfunctions. Mechanisms that allow nodal recovery during pathological processes remain poorly understood. A highly enriched nodal cytoskeletal protein βIV spectrin anchors and stabilizes the nodal complex to actin cytoskeleton. Loss of murine βIV spectrin allows the initial nodal organization, but causes gradual nodal destabilization. Mutations in human βIV spectrin cause auditory neuropathy and impairment in motor coordination. Similar phenotypes are caused by nodal disruption due to demyelination. Here we report on the precise timelines of nodal disorganization and reorganization by following disassembly and reassembly of key nodal proteins in βIV spectrin mice of both sexes before and after βIV spectrin re-expression at specifically chosen developmental time points. We show that the timeline of nodal restoration has different outcomes in the PNS and CNS with respect to nodal reassembly and functional restoration. In the PNS, restoration of nodes occurs within 1 month regardless of the time of βIV spectrin re-expression. In contrast, the CNS nodal reorganization and functional restoration occurs within a critical time window; after that, nodal reorganization diminishes, leading to less efficient motor recovery. We demonstrate that timely restoration of nodes can improve both the functional properties and the ultrastructure of myelinated fibers affected by long-term nodal disorganization. Our studies, which indicate a critical timeline for nodal restoration together with overall motor performance and prolonged life span, further support the idea that nodal restoration is more beneficial if initiated before any axonal damage, which is critically relevant to demyelinating disorders.SIGNIFICANCE STATEMENT Nodes of Ranvier are integral to efficient and rapid signal transmission along myelinated fibers. Various demyelinating disorders are characterized by destabilization of the nodal molecular complex, accompanied by severe reduction in nerve conduction and the onset of motor and sensory dysfunctions. This study is the first to report in vivo reassembly of destabilized nodes with sequential improvement in overall motor performance. Our study reveals that nodal restoration is achievable before any axonal damage, and that long-term nodal destabilization causes irreversible axonal structural changes that prevent functional restoration. Our studies provide significant insights into timely restoration of nodal domains as a potential therapeutic approach in treatment of demyelinating disorders.

Keywords: axonal health; motor coordination; myelination; nerve conduction; nodal restoration; nodes of Ranvier.


Figures

Figure 1.
Figure 1.
Removal of Rosaβgeo insertion allows re-expression of βIV spectrin. A, Partial genomic map of the Sptbn4 locus and the location of the gene trap Rosa βgeo* insertion, which is removed by Cre-mediated recombination. Red arrowheads represent location of primers that were used for qRT-PCR amplification of Sptbn4 transcripts. B, PCR amplification of genomic tail DNA isolated from wild-type (+/+), heterozygous (Sptbn4geo/+), and homozygous floxed (Sptbn4geo) mice. C–L, Immunostaining of teased SN fibers (C–G) and SCs (H–L) from control (+/+) (C, H), Sptbn4geo mutant (D, I), and tamoxifen-injected 2-month-old, 5-month-old, and 8-month-old actin-CreER;Sptbn4geo mice after 1 mpi (E–G, J–L, Sptbn4res) with antibodies against nodal βIV spectrin (red) and paranodal Caspr (green). Red arrowheads point to βIV spectrin-positive nodes and white arrowheads indicate βIV spectrin-negative nodes. M, N, Percentage of βIV spectrin-positive nodes in SNs (M) and SCs (N) of control, Sptbn4geo mutant, and Sptbn4res rescue animals depicted in C–L. Data are represented as mean ± SEM. n = 3 mice per genotype, with ≥100 and 200 nodes/animal for SNs and SCs, respectively. ***p < 0.001, one-way ANOVA, Bonferroni's post hoc analysis. Scale bar, 4 μm. O–Q, Immunoblot analysis of SN (O), SC (P), and brain (Q) lysates from control, Sptbn4geo mutant, and Sptbn4res rescue animals 1 mpi with antibodies against βIV spectrin (top) and tubulin (bottom). R, S, qPCR analysis of relative mRNA quantity in DRG (R) and SC (S) samples from control, Sptbn4geo mutant, and Sptbn4res rescue animals 1 mpi using primers specific to various exon/intron junctions of the Sptbn4 locus (exons 17/18, 20/21, and 31/32, depicted in the schematic in A as 1-2, 3-4, and 5-6, respectively). Data are represented as mean ± SEM. n = 4–7 mice per genotype. ***p < 0.001, one-way ANOVA, Bonferroni's post hoc analysis. T, Schematic representing the design of rescue strategies. Tamoxifen injection times in actin-CreER;Sptbn4geo animals and the timeline for phenotypic analysis of the two rescue groups.
Figure 2.
Figure 2.
Timeline of disorganization and reorganization of the nodes in the PNS. A–R, Immunostaining of SN fibers from 5–10-month-old age-matched control (+/+), Sptbn4geo mutant, and Sptbn4res mice with antibodies against βIV spectrin (blue) and Caspr (green) in combination with antibodies against either of the following proteins: AnkG (A–F), pan-NaV (G–L), or NfascNF186 (M–R; red). Arrows indicate βIV spectrin-negative nodes. Scale bar, 4 μm. S–V, Quantification of average fluorescence intensities of βIV spectrin (S), AnkG (T), pan-NaV (U), and NfascNF186 (V) in the SN nodes standardized to the same age control values from 4–10-month-old age-matched control (+/+), Sptbn4geo mutant, and Sptbn4res mice (n = 300 nodes from 3 mice per genotype; ≥100 nodes per animal, all data are represented as mean ± SEM. *p < 0.05; **p < 0.01; ***p < 0.001; 2-way ANOVA with Bonferroni's post hoc analysis; red stars indicate rescue group statistical significance compared with the age-matched mutants; black stars indicate rescue and mutant group statistical significance compared with the age-matched controls). W–Y′, Distribution of AnkG (W, W′), NaV (X, X′), and NfascNF186 (Y, Y′) nodal fluorescence intensities in SNs in control (+/+), Sptbn4geo mutant, and Sptbn4res mice at the initial prerescue stage and at the latest rescue time points (n = 300 nodes from 3 mice per genotype; ≥100 nodes per animal). Fluorescence intensity, arbitrary units (A.U.) × 100.
Figure 3.
Figure 3.
Timeline of disorganization and reorganization of the nodes in the CNS. A–R, Immunostaining of SCs from 5–10-month-old age-matched control (+/+), Sptbn4geo mutant, and Sptbn4res mice with antibodies against βIV spectrin (blue) and Caspr (green) in combination with antibodies against either of the following proteins: AnkG (A–F), NaV (G–L), or NfascNF186 (M–R; red). White and yellow arrows indicate βIV spectrin-negative and βIV spectrin-positive nodes, respectively. Scale bar, 4 μm. S–V, Quantification of average fluorescence intensities of βIV spectrin (S), AnkG (T), pan-NaV (U), and NfascNF186 (V) in the SC nodes standardized to the same age control values from 4–7-month-old and 7–10-month-old age-matched control (+/+), Sptbn4geo mutant, and Sptbn4res mice (n = 600 nodes from 3 mice per genotype; ≥200 nodes per animal; all data are represented as mean ± SEM. *p < 0.05; **p < 0.01; ***p < 0.001; 2-way ANOVA with Bonferroni's post hoc analysis; red stars indicate rescue group statistical significance compared with the age-matched mutants; black stars indicate rescue and mutant group statistical significance compared with the age-matched controls). W–Y′, Distribution of the nodal population by their intensities of AnkG (W, W′), NaV (X, X′), and NfascNF186 (Y, Y′) in control (+/+), Sptbn4geo mutant, and Sptbn4res mice at the initial prerescue and at the latest rescue time point (n = 600 nodes from 3 mice per genotype; ≥200 nodes per animal). Fluorescence intensity: arbitrary units (A.U.) × 100.
Figure 4.
Figure 4.
Re-expression of βIV spectrin displaces βI spectrin. A–L, Immunostaining of SNs (A–F) and SCs (G–L) from 5–10-month-old age-matched control (+/+), Sptbn4geo mutant, and Sptbn4res mice with antibodies against βI spectrin (red), βIV spectrin (blue), and Caspr (green). White and yellow arrows indicate βIV spectrin-negative and βIV spectrin-positive nodes, respectively. Scale bar, 4 μm. M, N, Quantification of βI spectrin average fluorescence intensity in the SN (M) and SC (N) nodes standardized to the same age control values from 4–10-month-old age-matched control (+/+), Sptbn4geo mutant, and Sptbn4res mice (n = 300 from 3 mice, with ≥100 nodes per animal in SNs; n = 600 from 3 mice, with ≥200 nodes from each animal in SCs; all data are represented as mean ± SEM; *p < 0.05; **p < 0.01; ***p < 0.001; 2-way ANOVA with Bonferroni's post hoc analysis; red stars indicate rescue group statistical significance compared with the age-matched mutants; black stars indicate rescue and mutant group statistical significance compared with the age-matched controls). O–R, Distribution of the nodal βI spectrin fluorescence intensities in SNs (O, P) and SCs (Q, R) at the initial prerescue stage and at the latest rescue time point (n = 300 nodes from 3 mice per genotype in SNs; n = 600 nodes from 3 mice per genotype in SCs). Fluorescence intensity: arbitrary units (A.U.) × 100.
Figure 5.
Figure 5.
Newly expressed βIV spectrin causes decrease in AnkR levels at the nodes. A–L, Immunostaining of SNs (A–F) and SCs (G–L) from 4–10-month-old age-matched control (+/+), Sptbn4geo mutant, and Sptbn4res mice with antibodies against AnkR (red), βIV spectrin (blue), and Caspr (green). Yellow and white arrows indicate βIV spectrin-negative and βIV spectrin-positive nodes, respectively. Scale bar, 4 μm. M–P, Distribution of the nodal population by their nodal AnkR fluorescence intensities in SNs (M, N) and SCs (O, P) at the initial prerescue stage and at the latest rescue time point (n = 300 nodes from 3 mice per genotype in SNs; n = 600 nodes from 3 mice per genotype in SCs). Fluorescence intensity: arbitrary units (A.U.) × 100. Q, R, Quantification of average AnkR fluorescence intensity in the SN (Q) and SC (R) nodal area standardized to the same age control values from 4–10-month-old age-matched control (+/+), Sptbn4geo mutant, and Sptbn4res mice (n = 300, with ≥100 nodes from each animal's SNs; n = 600, with ≥200 nodes from each animal's SCs. All data are represented as mean ± SEM; *p < 0.05; **p < 0.01; ***p < 0.001; 2-way ANOVA with Bonferroni's post hoc analysis).
Figure 6.
Figure 6.
Timely reorganization of nodes prevents axonal degeneration. A–L, TEM of cross sections from 7-month-old (A–F) and 10-month-old (G–L) age-matched control (+/+), Sptbn4geo mutant, and Sptbn4res mice SNs (A–C, G–I) and SCs (D–F, J–L). M–R, Axonal pathology seen in Sptbn4geo mutants. TEM images at higher magnification showing different stages of axonal degeneration, starting with the accumulation of cytoskeletal inclusions (M, N, Q, R), which eventually results in axon and myelin structural disintegration (O, P). S, T, Quantification of axonal degeneration in 7-month-old and 10-month-old age-matched control (+/+), Sptbn4geo mutant, and Sptbn4res mice in the PNS and CNS, respectively (n = 3 mice/genotype, 2-way ANOVA, Bonferroni's post hoc analysis). All data are represented as mean ± SEM. *p < 0.05; **p < 0.01; ***p < 0.001, two-way ANOVA, Bonferroni's post hoc analysis. Scale bars: A–L, 4 μm; M–P, 400 nm; Q, R, 1 μm.
Figure 7.
Figure 7.
Motor function and nerve conduction restoration after βIV spectrin re-expression. A–C, Photographs of 10-month-old control (+/+), Sptbn4geo mutant, and Sptbn4res mice at 3 mpi. D–F, Representative Catwalk footprints of 10-month-old control (+/+), Sptbn4geo mutant, and Sptbn4res mice at 3 mpi. G, Quantifications of the average running speed from Catwalk gait recordings of early-rescue and late-rescue mice (n = 7–10 mice/genotype). H, Body-mass change in control (+/+), Sptbn4geo mutant, and Sptbn4res mice at early-rescue and late-rescue stages. Equal numbers of males and females were included in each control (+/+), Sptbn4geo mutant, and Sptbn4res early-rescue and late-rescue groups (n = 7–10 mice/genotype). I, Survival curve for control (+/+), Sptbn4geo mutant, and Sptbn4res early-rescue and late-rescue groups. J, Representative electrophysiological profiles of CAPs from 7-month-old and 10-month-old SNs of control (+/+), Sptbn4geo mutant, and Sptbn4res early-rescue and late-rescue groups. K, L, Quantification of the NCV (K) and amplitude (L) in control (+/+), Sptbn4geo mutant, and Sptbn4res early-rescue and late-rescue groups (n = 7–10 mice/genotype). All data are represented as mean ± SEM. *p < 0.05; **p < 0.01; ***p < 0.001, two-way ANOVA, Bonferroni's post hoc analysis.

Comment in

Similar articles

Cited by

References

    1. Ahn KH, Lyoo IK, Lee HK, Song IC, Oh JS, Hwang J, Kwon J, Kim MJ, Kim M, Renshaw PF (2004) White matter hyperintensities in subjects with bipolar disorder. Psychiatry Clin Neurosci 58:516–521. 10.1111/j.1440-1819.2004.01294.x - DOI - PubMed
    1. Aoki Y, Abe O, Nippashi Y, Yamasue H (2013) Comparison of white matter integrity between autism spectrum disorder subjects and typically developing individuals: a meta-analysis of diffusion tensor imaging tractography studies. Mol Autism 4:25. 10.1186/2040-2392-4-25 - DOI - PMC - PubMed
    1. Arancibia-Carcamo IL, Attwell D (2014) The node of Ranvier in CNS pathology. Acta Neuropathol 128:161–175. 10.1007/s00401-014-1305-z - DOI - PMC - PubMed
    1. Berghs S, Ferracci F, Maksimova E, Gleason S, Leszczynski N, Butler M, De Camilli P, Solimena M (2001) Autoimmunity to beta IV spectrin in paraneoplastic lower motor neuron syndrome. Proc Natl Acad Sci U S A 98:6945–6950. 10.1073/pnas.121170798 - DOI - PMC - PubMed
    1. Bhat MA, Rios JC, Lu Y, Garcia-Fresco GP, Ching W, St Martin M, Li J, Einheber S, Chesler M, Rosenbluth J, Salzer JL, Bellen HJ (2001) Axon-glia interactions and the domain organization of myelinated axons requires neurexin IV/Caspr/Paranodin. Neuron 30:369–383. 10.1016/S0896-6273(01)00294-X - DOI - PubMed

Publication types

MeSH terms

LinkOut - more resources