. 2018 Aug;6(8):910-920.
doi: 10.1158/2326-6066.CIR-17-0581. Epub 2018 Jun 15.

Exosomes Shuttle TREX1-Sensitive IFN-Stimulatory dsDNA from Irradiated Cancer Cells to DCs

Affiliations

Exosomes Shuttle TREX1-Sensitive IFN-Stimulatory dsDNA from Irradiated Cancer Cells to DCs

Julie M Diamond et al. Cancer Immunol Res. 2018 Aug.

Abstract

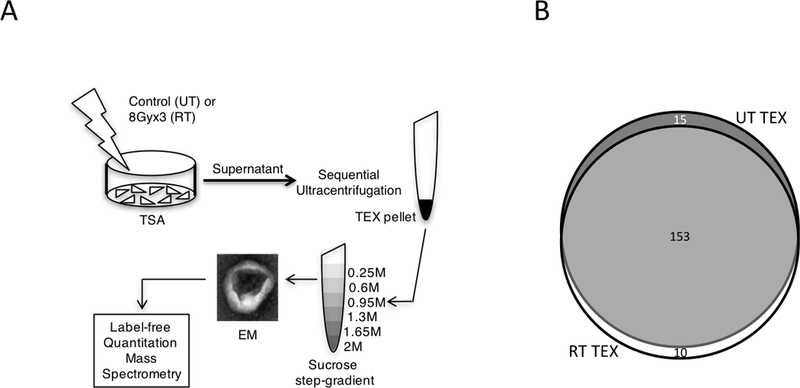
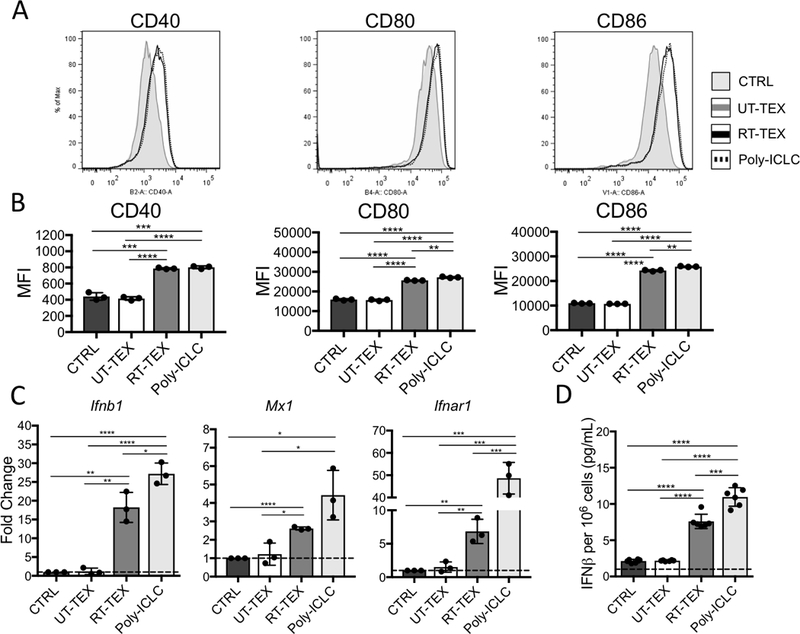
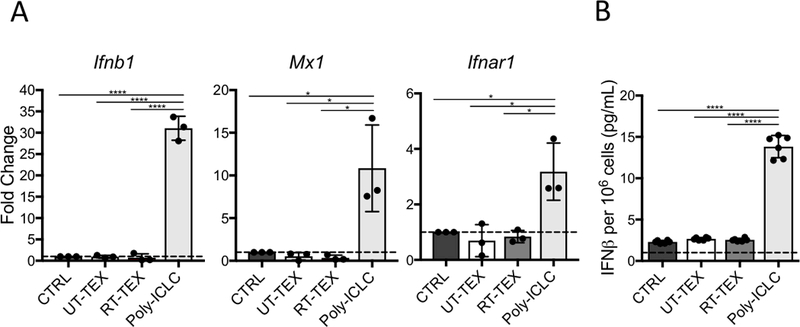
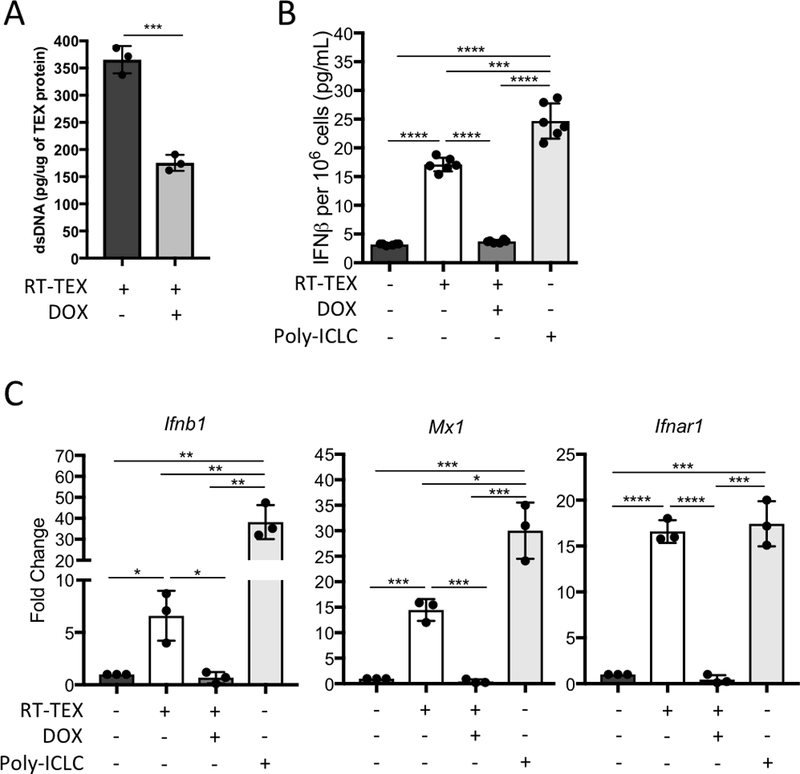
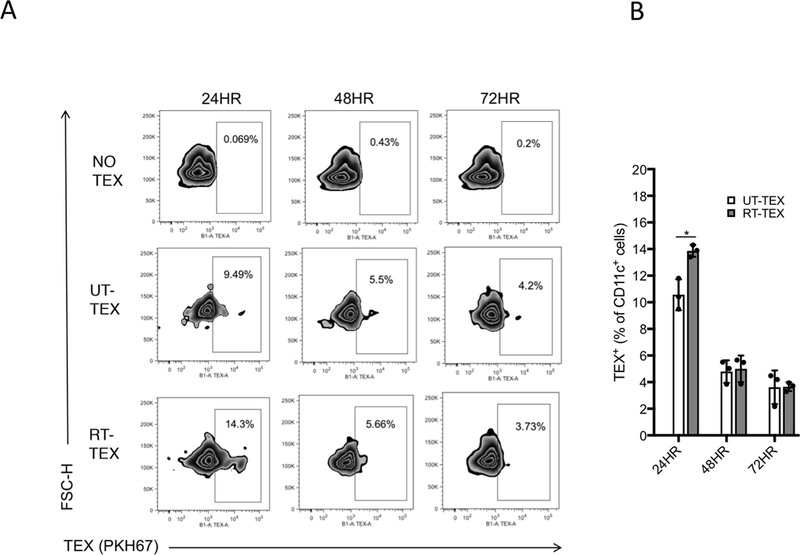
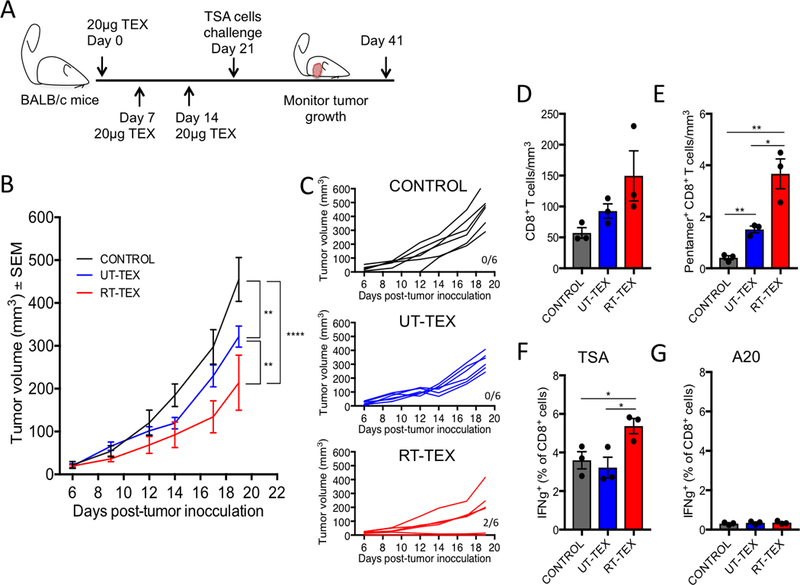
Radiotherapy (RT) used at immunogenic doses leads to accumulation of cytosolic double-stranded DNA (dsDNA) in cancer cells, which activates type I IFN (IFN-I) via the cGAS/STING pathway. Cancer cell-derived IFN-I is required to recruit BATF3-dependent dendritic cells (DC) to poorly immunogenic tumors and trigger antitumor T-cell responses in combination with immune checkpoint blockade. We have previously demonstrated that the exonuclease TREX1 regulates radiation immunogenicity by degrading cytosolic dsDNA. Tumor-derived DNA can also activate cGAS/STING-mediated production of IFN-I by DCs infiltrating immunogenic tumors. However, how DNA from cancer cells is transferred to the cytoplasm of DCs remains unclear. Here, we showed that tumor-derived exosomes (TEX) produced by irradiated mouse breast cancer cells (RT-TEX) transfer dsDNA to DCs and stimulate DC upregulation of costimulatory molecules and STING-dependent activation of IFN-I. In vivo, RT-TEX elicited tumor-specific CD8+ T-cell responses and protected mice from tumor development significantly better than TEX from untreated cancer cells in a prophylactic vaccination experiment. We demonstrated that the IFN-stimulatory dsDNA cargo of RT-TEX is regulated by TREX1 expression in the parent cells. Overall, these results identify RT-TEX as a mechanism whereby IFN-stimulatory dsDNA is transferred from irradiated cancer cells to DCs. We have previously shown that the expression of TREX1 is dependent on the RT dose size. Thus, these data have important implications for the use of RT with immunotherapy. Cancer Immunol Res; 6(8); 910-20. ©2018 AACR.


Conflict of interest statement

Conflict of interest statement: The authors have declared that no conflict of interest exists, but S.C.F has received speaker compensation from Bristol-Myer Squibb, Sanofi, Regeneron, Varian, Elekta and Janssen, S.D. has received honorarium from Lytix Biopharma, Astrazeneca, StemImmune, and AbbVie for advisory services.

Figures

Figure 1.
Figure 1.. Isolation and proteomic profiling of TEX.
(A) Schema of TEX isolation method. TSA mouse breast cancer cells were left untreated (UT) or irradiated with 8 Gy X 3 (RT) and supernatants were collected after 48 hours (h) for TEX purification as indicated. Purified TEX were analyzed by transmission electron microscopy (EM) and analyzed by LFQ-MS. (B) Venn diagram illustrating the number of shared and unique pathways represented in each TEX group. White: RT-TEX; Dark grey: UT-TEX; Light gray: Overlap.
Figure 2.
Figure 2.. RT-TEX induce activation and IFN-I production by primary DCs.
1 × 10⁶ CD11c+ DCs isolated from spleens were cultured for 48h with TEX (30 μg) or TLR3 agonist poly:ICLC (0.025 mg/mL) and analyzed for (A, B) expression of co-stimulatory molecules and (C, D) IFN-I pathway activation. (A) Histograms showing co-stimulatory molecule expression on DCs cultured with PBS (CTRL: shaded gray), UT-TEX (gray line), RT-TEX (black line), and poly:ICLC (black broken line). (B) Mean fluorescence intensity (MFI)±s.e.m. of samples in each group (n=3/group). MFI was calculated after subtracting background. (C) Gene expression evaluated by qRT-PCR. (D) IFNβ measured by ELISA in supernatant of DCs. Results are representative of two independent experiments. Using a Student’s two-tailed t-test, *p<0.05; **p<0.005; ***p<0.0005; ****p<0.00005.
Figure 3.
Figure 3.. IFN-I pathway activation by RT-TEX is STING-dependent.
1×10⁶ CD11c+ DCs isolated from spleens of STING-deficient mice were cultured for 48h with TEX (30 μg) or TLR3 agonist poly:ICLC (0.025 mg/mL) and analyzed for IFN-I pathway activation. (A) Gene expression evaluated by qRT-PCR. (B) IFNβ measured by ELISA in supernatant of DCs. Results are representative of two independent experiments. Using a Student’s two-tailed t-test, *p<0.05; ****p<0.00005.
Figure 4.
Figure 4.. IFN-stimulatory dsDNA in RT-TEX is regulated by Trex1 expression in parent cells.
(A) Quantification of internal dsDNA carried by TEX secreted by irradiated TSAKI Trex1 cells treated or not with doxycycline (DOX), as indicated, to induce Trex1. (B, C) 1 × 10⁶ CD11c+ DCs were cultured for 48h with TEX (30 μg) derived from TSAKI Trex1 cells treated or not with doxycycline (DOX; 4 μg/mL), as indicated, or with TLR3 agonist poly:ICLC (0.025 mg/mL) and analyzed for IFN-I pathway activation. (B) IFNβ measured by ELISA in supernatant of DCs. (C) Gene expression evaluated by qRT-PCR. Using a Student’s two-tailed t-test, *p<0.05; **p<0.005; ***p<0.0005; ****p<0.00005.
Figure 5.
Figure 5.. Uptake of TEX by DCs in vivo.
PKH67-labelled TEX (10 μg) were injected s.c. at the base of the tail, and the draining lymph nodes (DLN) were collected 24, 48, and 72h after injection (n=3/group per time point). DLN cells were stained with anti-CD11c to identify DCs. (A) Representative flow cytometry plots gated on CD11c+ DCs. Boxes encase PKH67+ DCs. (B) Mean percentage±s.e.m. of TEX+ CD11c+ cells at different times post-injection. Using a Student’s two-tailed t-test, *p<0.05.
Figure 6.
Figure 6.. Vaccination with RT TEX induces protective antitumor immunity.
Mice were vaccinated s.c. with 20 μg TEX and received boost vaccinations 7 and 14 days later (20 μg/boost), followed by challenge with a tumorigenic inoculum of 1 × 10⁵ TSA cells. (A) Experimental schema depicting vaccination and challenge schedule. (B) Tumor growth in each group post-challenge (n=6/group). (C) Individual mouse tumor growth curves. Numbers indicate mice without tumor/total mice. (D, E) Tumors infiltrating T cells analyzed at day 20 post challenge by flow cytometry. (D) Density of CD8+ T cells in each treatment group (n=3/group). (E) Density of tumor-specific CD8+ T cells as determined by Ld/AH1 pentamer staining. (F, G) Spleen T cells harvested at day 20 post challenge and tested for IFNγ production by intracellular staining after in vitro activation and incubation with (F) 1 × 10⁴ of either TSA cells or (G) the irrelevant target A20 lymphoma cells. All data are representative of two independent experiments. Using a Student’s two-tailed t-test, *p<0.05; **p<0.005.

References

    1. Sharma P, Allison JP. Immune checkpoint targeting in cancer therapy: toward combination strategies with curative potential. Cell 2015;161(2):205–14 doi 10.1016/j.cell.2015.03.030. - DOI - PMC - PubMed
    1. Demaria S, Coleman CN, Formenti SC. Radiotherapy: Changing the Game in Immunotherapy. Trends Cancer 2016;2(6):286–94 doi 10.1016/j.trecan.2016.05.002. - DOI - PMC - PubMed
    1. Vacchelli E, Bloy N, Aranda F, Buque A, Cremer I, Demaria S, et al. Trial Watch: Immunotherapy plus radiation therapy for oncological indications. Oncoimmunology 2016;5(9):e1214790 doi 10.1080/2162402X.2016.1214790. - DOI - PMC - PubMed
    1. Apetoh L, Ghiringhelli F, Tesniere A, Obeid M, Ortiz C, Criollo A, et al. Toll-like receptor 4-dependent contribution of the immune system to anticancer chemotherapy and radiotherapy. Nat Med 2007;13(9):1050–9 doi 10.1038/nm1622. - DOI - PubMed
    1. Golden EB, Apetoh L. Radiotherapy and immunogenic cell death. Semin Radiat Oncol 2015;25(1):11–7 doi 10.1016/j.semradonc.2014.07.005. - DOI - PubMed

Publication types

MeSH terms