. 2018 Jun 15;9(1):2359.
doi: 10.1038/s41467-018-04791-8.

Efficient RNA drug delivery using red blood cell extracellular vesicles

Affiliations

Efficient RNA drug delivery using red blood cell extracellular vesicles

Waqas Muhammad Usman et al. Nat Commun. .

Abstract

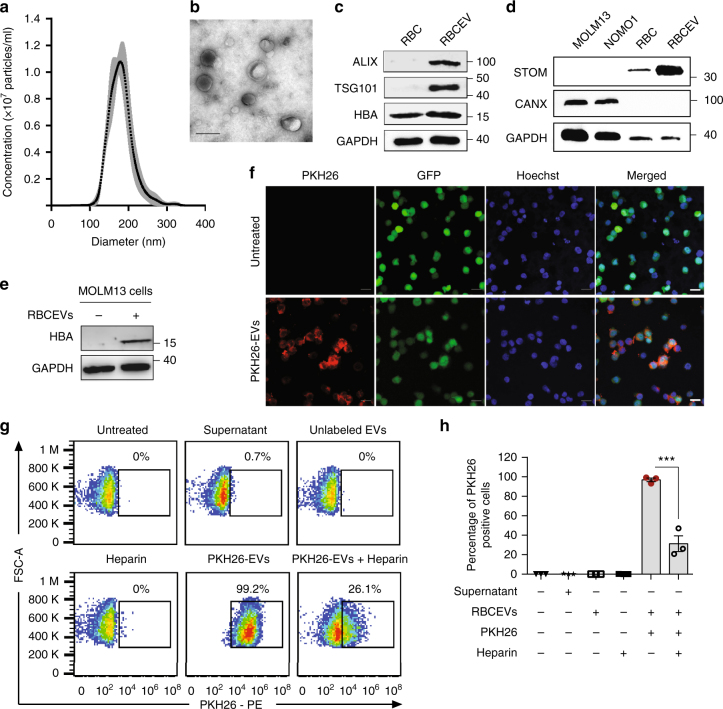
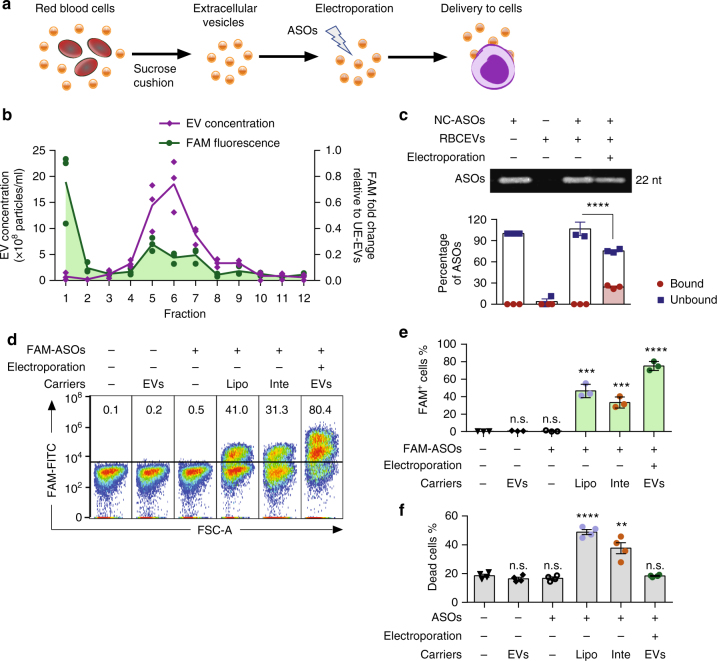
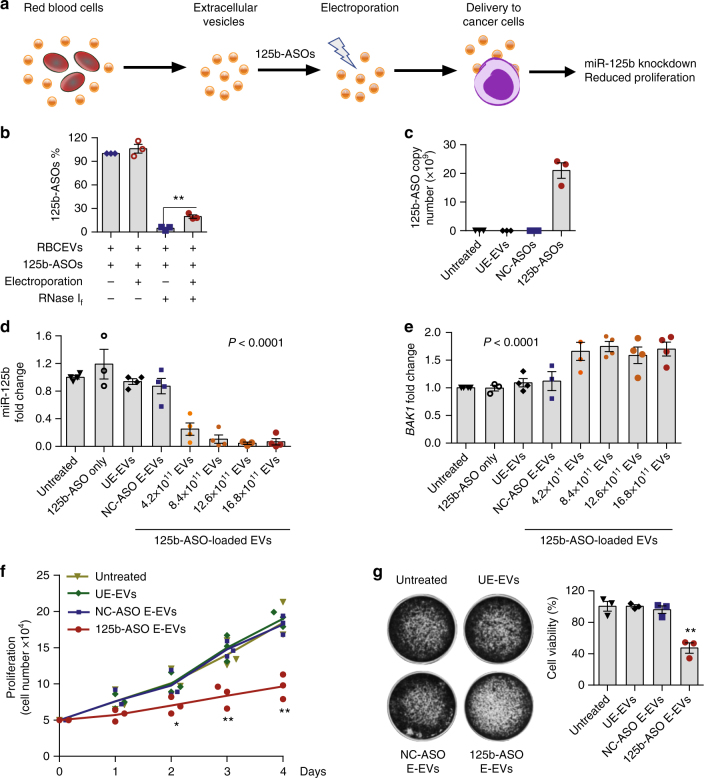
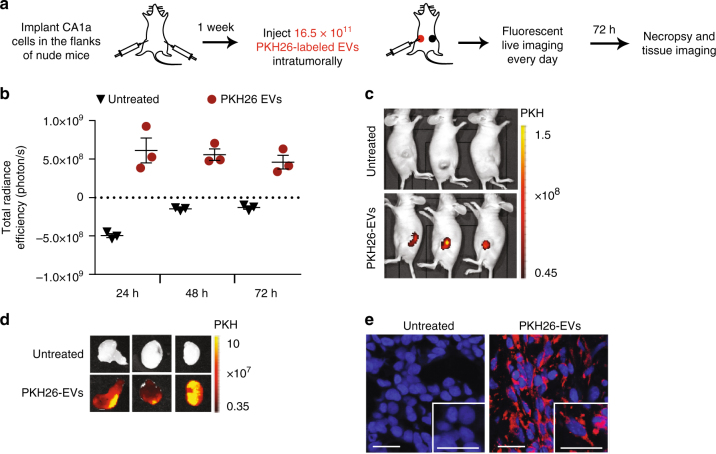
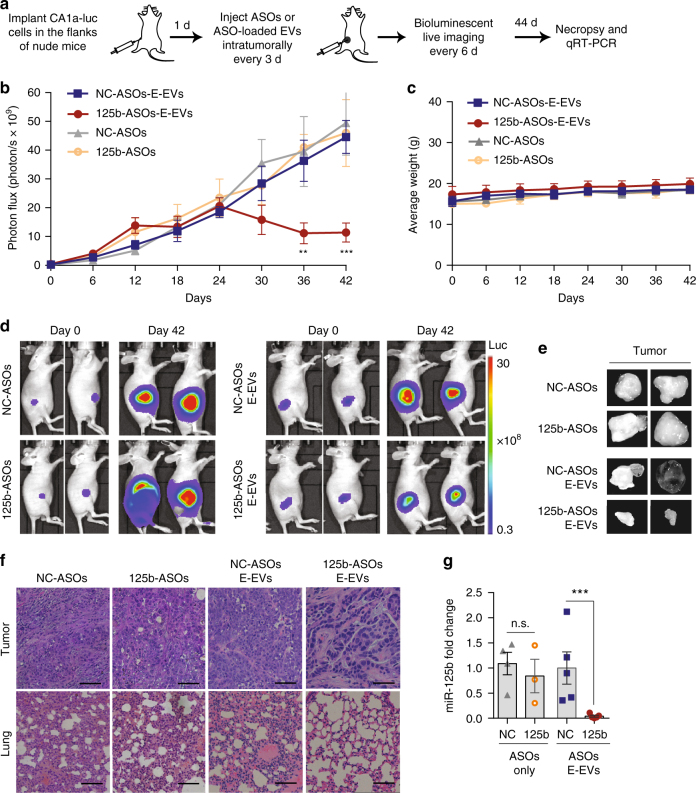
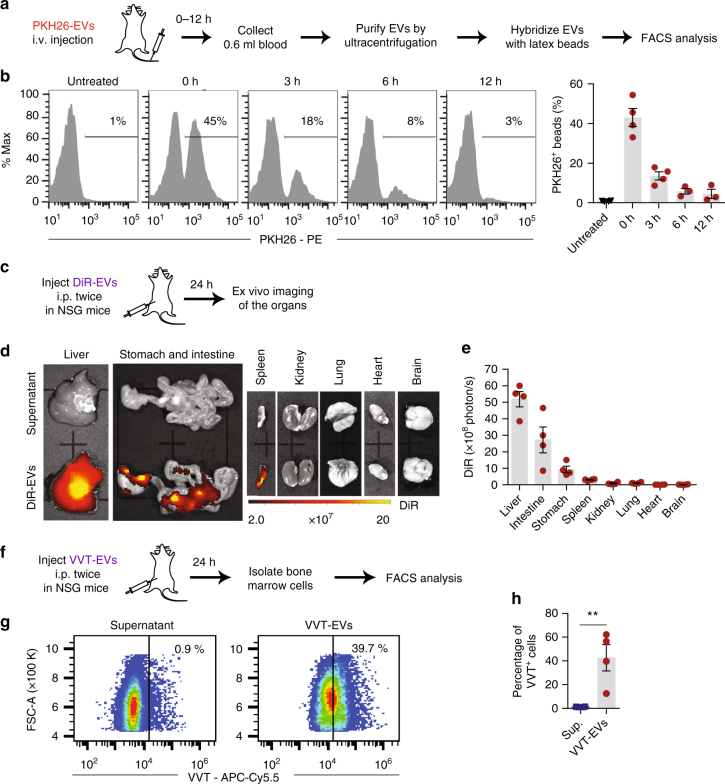
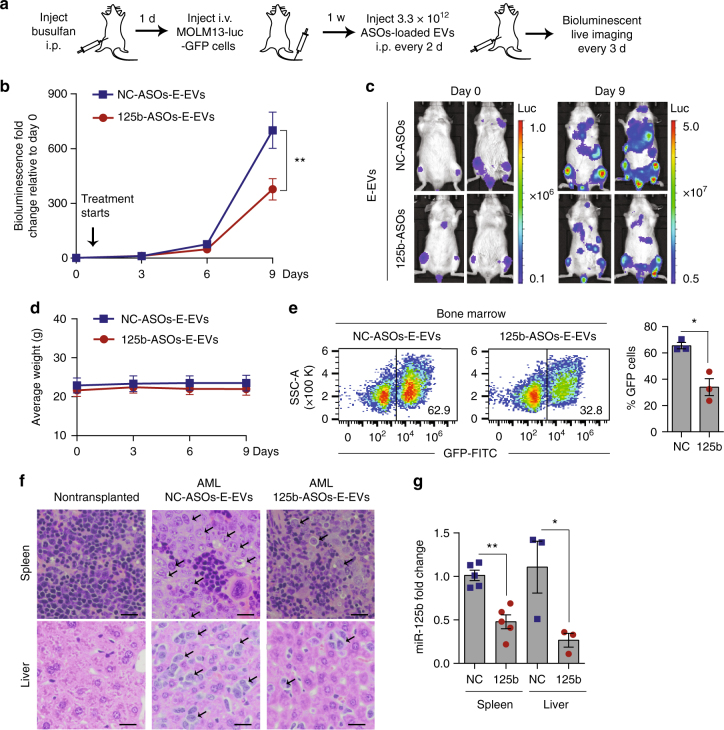
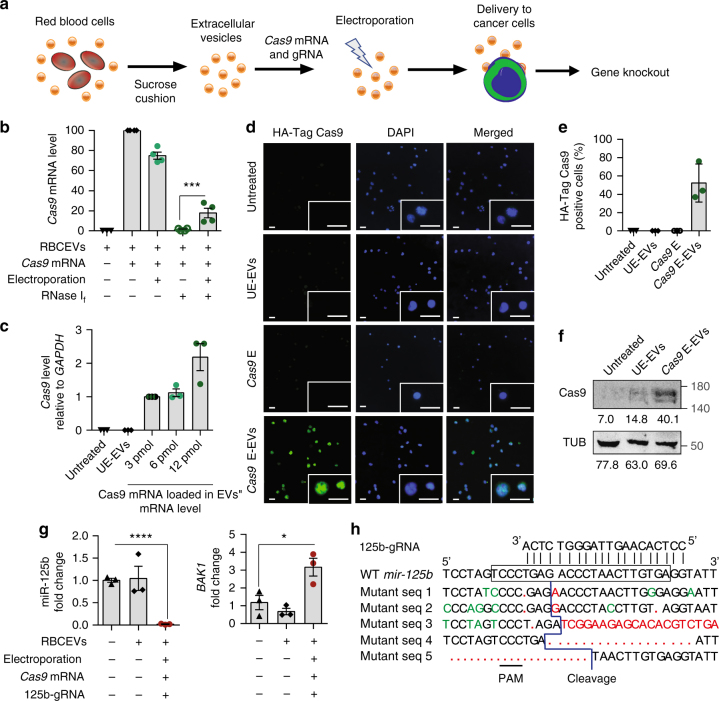
Most of the current methods for programmable RNA drug therapies are unsuitable for the clinic due to low uptake efficiency and high cytotoxicity. Extracellular vesicles (EVs) could solve these problems because they represent a natural mode of intercellular communication. However, current cellular sources for EV production are limited in availability and safety in terms of horizontal gene transfer. One potentially ideal source could be human red blood cells (RBCs). Group O-RBCs can be used as universal donors for large-scale EV production since they are readily available in blood banks and they are devoid of DNA. Here, we describe and validate a new strategy to generate large-scale amounts of RBC-derived EVs for the delivery of RNA drugs, including antisense oligonucleotides, Cas9 mRNA, and guide RNAs. RNA drug delivery with RBCEVs shows highly robust microRNA inhibition and CRISPR-Cas9 genome editing in both human cells and xenograft mouse models, with no observable cytotoxicity.


Conflict of interest statement

The authors declare no competing interests.

Figures

Fig. 1
Fig. 1
Characterization of EVs from RBCs and uptake of RBCEVs by leukemia cells. a Average concentrations (100,000 × dilution) of RBCEVs from three donors ± SEM (gray) and their size distribution, determined using a Nanosight nanoparticle analyzer. b Representative transmission electron microscopy image of RBCEVs. Scale bar: 100 nm. c Western blot analysis of EV markers ALIX and TSG101; and RBC marker Hemoglobin A (HBA) relative to GAPDH (loading control) in cell lysates and EVs from RBCs. d Western blot analysis of Stomatin (STOM) and Calnexin (CANX) as the markers of RBCEVs and endoplasmic reticulum, respectively, relative to GAPDH, in leukemia MOLM13 cells, NOMO1 cells, RBCs, and RBCEVs. e Western blot analysis of HBA relative to GAPDH in leukemia MOLM13 cells untreated or incubated with 8.25 × 1011 RBCEVs for 24 h. f Representative immunofluorescent images of MOLM13-GFP cells incubated with 12.4 × 1011 PKH26-labeled EVs for 24 h. Scale bar, 20 µm. g FACS analysis of PKH26 in MOLM13 cells that were incubated with 12.4 × 1011 unlabeled or PKH26-labeled EVs with and without Heparin for 24 h. The supernatant of the last wash after PKH26 labeling was used to determine the background. Percentages of PKH26-positive cells are indicated above the gates. h Average percentage of PKH26-positive cells in each condition (mean ± SEM, n = 3 cell passages). P value (***P < 0.001) was determined using Student’s one-tail t-test. In ce, molecular weights (KDa) of protein markers are shown on the right. Each experiment was repeated two to three times in 2–3 cell passages
Fig. 2
Fig. 2
Electroporation of RBCEVs with ASOs and delivery to leukemia cells. a Experimental scheme of ASOs delivery by RBCEVs. b Average concentration of EVs (200× dilution) and average fold change in FAM fluorescent intensity relative to unelectroporated EVs (UE-EVs) of 12 fractions in a sucrose gradient separation of RBCEVs electroporated with a FAM-labeled scrambled negative control ASOs (FAM-NC-ASOs), determined using a Nanosight analyzer and Synergy fluorescent microplate reader, respectively, n = 3 repeats. c Separation of unbound NC-ASOs (unlabeled) from 8.25 × 1011 unelectroporated or electroporated RBCEVs compared to the untreated NC-ASOs (200 pmol) in 10% native gel, visualized using SYBR Gold staining (top) and the average percentage of NC-ASOs unbound or bound to electroporated RBCEVs (bottom), n = 3 independent replicates. d FACS analysis of FAM fluorescence vs. forward scatter area (FSC-A) in MOLM13 cells transfected with 400 pmol FAM-NC-ASO using LipofectamineTM 3000 (Lipo), INTERFERin® (Inte) or 12.4 × 1011 RBCEVs. Percentages of FAM-positive cells are indicated above the gate. e Average percentages of FAM+ cells among viable MOLM13 cells transfected or treated with RBCEVs containing FAM ASOs as in d, n = 3 repeats. f Percentages of dead cells determined by propidium iodide staining among MOLM13 cells transfected or treated with RBCEVs containing unlabeled NC-ASOs, n = 4 repeats. All graphs present mean ± SEM. Student’s one-tail t-test results are shown as n.s. non-significant; **P < 0.01; ***P < 0.001 and ****P < 0.0001 relative to the unelectroporated control (c) or to the untreated control (e, f)
Fig. 3
Fig. 3
RBCEVs deliver ASOs to leukemia and breast cancer cells for miR-125b inhibition. a Experimental scheme of ASOs delivery to cancer cells using RBCEVs. b Percentage of anti-miR-125b ASOs (125b-ASOs) associated with 6.2 × 1011 unelectroporated or 125b-ASO-electroporated RBCEVs after a treatment with RNase If for 30 min. c Copy number of 125b-ASO in MOLM13 cells treated with 12.4 × 1011 RBCEVs unelectroporated (UE-EVs) or RBCEVs electroporated with NC-ASOs or with 125b-ASOs for 72 h. d Expression fold change of miR-125b in MOLM13 cells that were incubated with 125b-ASOs alone, 16.8 × 1011 unelectroporated RBCEVs (UE-EVs), 16.8 × 1011 NC-ASOs-loaded RBCEVs, or 4.2 to 16.8 × 1011 125b-ASOs loaded RBCEVs. miR-125b expression was determined using Taqman qRT-PCR normalized to U6b RNA and presented as average fold change relative to the untreated control. e Expression fold change of BAK1 in MOLM13 cells treated as in d, determined using SYBR Green qRT-PCR, normalized to GAPDH and presented as average fold change relative to the untreated control. f Proliferation of MOLM13 cells treated with 12.4 × 1011 unelectroporated or NC/125b-ASO-electroporated EVs, determined using cell counts. g Viability of breast cancer CA1a cells (%) treated as in f, determined by crystal violet staining. In all panels, the experiments were repeated three or four times with 3 or 4 cell passages. Bar graphs present mean ± SEM. P values were calculated using one-way ANOVA test (d, e) or student’s one-tail t-test relative to the untreated controls (b, f, g) *P < 0.05, **P < 0.01
Fig. 4
Fig. 4
RBCEVs are taken up by breast cancer cells in vivo. a Schema of an in vivo EV uptake assay. b Total radiance efficiency of PKH26 fluorescence in the tumors 24 to 72 h after an intratumoral injection of 16.5 × 1011 PKH26-labeled RBCEVs, determined using an in vivo imaging system (IVIS), presented as mean ± SEM (n = 3 mice). c Images of the mice bearing untreated tumors on the right flank and tumors injected with PKH26 -labeled EVs on the left flank, 72 h post-treatment, captured using IVIS. PKH26 is shown in pseudocolored radiance. d Images of the tumors excised from the mice in c. e Representative confocal microscopy images of tumor sections with DAPI stained nuclei and PKH26 signals from the cells with EV uptake. Scale bar, 20 µm
Fig. 5
Fig. 5
Treatment with ASOs-loaded RBCEVs suppresses tumor growth by miR-125b knockdown. a Schema of ASOs delivery to nude mice bearing breast cancer xenografts. b Average bioluminescent photon flux of the tumors treated every 3 days with intratumoral injection of 8.25 × 1011 RBCEVs containing NC/125b-ASOs (E-EVs, n = 8 mice) or with 400 pmol NC/125b-ASOs (n = 6 mice), determined using IVIS (mean ± SEM). c Average weight of the mice (mean ± SEM). d Representative images on day 0 and 42. Bioluminescence is shown in pseudocolored radiance. e Representative pictures of the tumors on day 44. f Representative H & E staining images of the tumor and the lung collected on day 44. Scale bar, 50 μm. g miR-125b fold change relative to U6b RNA and NC condition in the tumors after 44 days of treatments, determined using Taqman qRT-PCR (mean ± SEM). P values were determined using one-tail Mann–Whitney test b, g: **P < 0.01; ***P < 0.001; n.s. non-significant. The whole experiment was performed in three independent repeats (three batches of mice)
Fig. 6
Fig. 6
Biodistribution of RBCEVs upon systemic administration in NSG mice. a Experimental schema for determination of RBCEV circulation time following an i.v. injection. b FACS analysis of PKH26 fluorescence on the beads that were bound to total EVs from the blood of NSG mice immediately (0 h) or 3, 6, 12 h after the i.v. injection of 3.3 × 1012 PKH26-labeled RBCEVs. The percentage of PKH26-positive beads are shown above the gate and the average is shown in the bar graph (mean ± SEM; n = 3 or 4 mice in two repeats). c Experimental schema for determination of RBCEV biodistribution in NSG mice. d Representative images of the organs 24 h after 2 i.p. injections (24 h apart) of 3.3 × 1012 DiR-labeled RBCEVs or the supernatant from the last wash of labeled EVs. Images were captured using IVIS. DiR fluorescence is shown in pseudocolored radiance. e Average DiR radiance in the organs of the mice injected with DiR-labeled RBCEVs (mean ± SEM; n = 4 mice in 2 repeats). f Experimental schema for determination of vivotrack-680 (VVT)-labeled RBCEV distribution to the bone marrow in NSG mice. g FACS analysis of VVT fluorescence (APC-Cy5.5) vs. FSC-A of bone marrow cells from the mice 24 h after 2 i.p. injections (24 h apart) of 3.3 × 1012 VVT-labeled RBCEVs or the EV wash supernatant (Sup). h Average percentage of VVT-positive cells (mean ± SEM, n = 4 mice in 2 repeats). **P < 0.01, one-tail Mann–Whitney test
Fig. 7
Fig. 7
Systemic delivery of miR-125b ASOs in RBCEVs suppresses leukemia progression in AML xenografted mice. a Experimental schema of AML xenografting and ASOs delivery in NSG mice. b Average fold change in total body bioluminescence of the mice after 0 to 9 days of treatment with 3.3 × 1012 RBCEVs containing NC-ASOs (n = 7 mice) or 125b-ASOs (n = 6 mice) relative to the signals before the treatment started (day 0), determined using an IVIS (mean ± SEM). c Representative images of the leukemic mice on day 0 & 9, captured using the IVIS. Bioluminescence is shown in pseudocolors. d Average weight of the mice (mean ± SEM). e FACS analysis of GFP cells in the bone marrow of the leukemic mice: representative dot plot of GFP (FITC channel) vs. size scatter area (SSC-A) and the average percentage of GFP-positive cells (mean ± SEM, n = 3 mice/group). f Representative H & E staining images of the spleen and liver from a nontransplanted mouse and from AML mice treated with NC/125b-ASOs-loaded RBCEVs. Arrows indicate clusters of infiltrating leukemia cells that have larger nuclei than normal cells. Scale bar, 50 μm. g miR-125b expression fold change normalized to U6B RNA in the spleen (n = 5 mice) and liver (n = 3 mice), determined using Taqman qRT-PCR and presented as mean fold change ± SEM relative to NC in the spleen. *P < 0.05; **P < 0.01 determined using one-tail Mann–Whitney test (b, e, g). The whole experiment was performed in two independent repeats
Fig. 8
Fig. 8
RBCEVs deliver Cas9 mRNA and gRNA to leukemia cells for genome editing. a Schema of Cas9 mRNA and gRNA delivery. b Average level of Cas9 mRNA in 6.2 × 1011 RBCEVs untreated, incubated or electroporated with 6 pmol Cas9 mRNA and treated with RNase If, relative to the unelectroporated Cas9 level (2nd condition). c The level of Cas9 mRNA relative to GAPDH mRNA in MOLM13 cells that were incubated with 12.4 × 1011 unelectroporated RBCEVs (UE-EVs) or RBCEVs electroporated with 3, 6, or 12 pmol Cas9 mRNA (E-EVs) after 24 h of treatment, relative to the 3 pmol condition. d Representative images of MOLM13 cells that were incubated for 48 h with 12.4 × 1011 UE-EVs or EVs that were electroporated with 6 pmol Cas9 mRNAs. MOLM13 cells were also electroporated directly with 6 pmol Cas9 mRNAs (Cas9 E) for comparison. The cells were stained for HA-Cas9 protein (green) and nuclear DNA (Hoechst, blue). Scale bar, 20 μm. e Average percentage of MOLM13 cells stained positive for HA-Cas9 protein as shown in d. f Western blot analysis of Cas9 and α-tubulin (TUB) in MOLM13 cells untreated, treated with 12.4 × 1011 unelectroporated or 6 pmol-Cas9 mRNA-loaded RBCEVs. Below each band is its mean intensity, quantified using ImageJ. g miR-125b and BAK1 expression fold change, relative to untreated condition, normalized to U6b RNA and 18s RNA respectively, in MOLM13 cells treated with 12.4 × 1011 UE-EVs or EVs loaded with 6 pmol Cas9 mRNA and mir-125b-targeting gRNA for 48 h. h Alignment of mir-125b-targeting gRNA with wildtype (WT) mir-125b (frame indicates mature sequence) and mutant DNA sequences from MOLM13 cells treated as in g. Red, insertion or deletion. Green, mismatch. PAM protospacer adjacent motif. All the bar graphs are presented as mean ± SEM (n = 3 or 4 repeats of 3 or 4 cell passages). *P < 0.05; ***P < 0.001; ****P < 0.0001: one-tail Student’s t-test

Comment in

References

    1. Dowdy SF. Overcoming cellular barriers for RNA therapeutics. Nat. Biotechnol. 2017;35:222–229. doi: 10.1038/nbt.3802. - DOI - PubMed
    1. Beaudet AL, Meng L. Gene-targeting pharmaceuticals for single-gene disorders. Hum. Mol. Genet. 2016;25:R18–R26. doi: 10.1093/hmg/ddv476. - DOI - PMC - PubMed
    1. Khvorova A, Watts JK. The chemical evolution of oligonucleotide therapies of clinical utility. Nat. Biotechnol. 2017;35:238–248. doi: 10.1038/nbt.3765. - DOI - PMC - PubMed
    1. Juliano RL. The delivery of therapeutic oligonucleotides. Nucleic Acids Res. 2016;44:6518–6548. doi: 10.1093/nar/gkw236. - DOI - PMC - PubMed
    1. Simões S, et al. Cationic liposomes for gene delivery. Expert Opin. Drug Deliv. 2005;2:237–254. doi: 10.1517/17425247.2.2.237. - DOI - PubMed

Publication types