. 2018 Jun 15;8(1):9165.
doi: 10.1038/s41598-018-27289-1.

Optical imaging featuring both long working distance and high spatial resolution by correcting the aberration of a large aperture lens

Affiliations

Optical imaging featuring both long working distance and high spatial resolution by correcting the aberration of a large aperture lens

Changsoon Choi et al. Sci Rep. .

Abstract

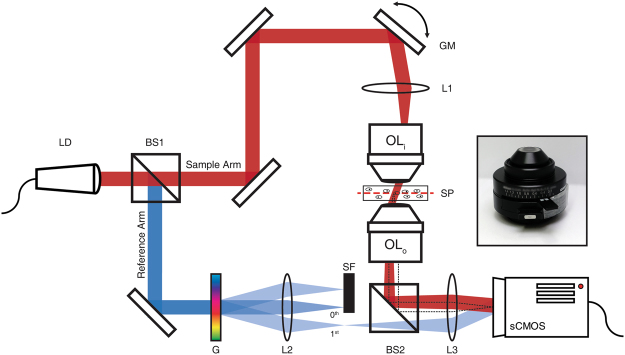
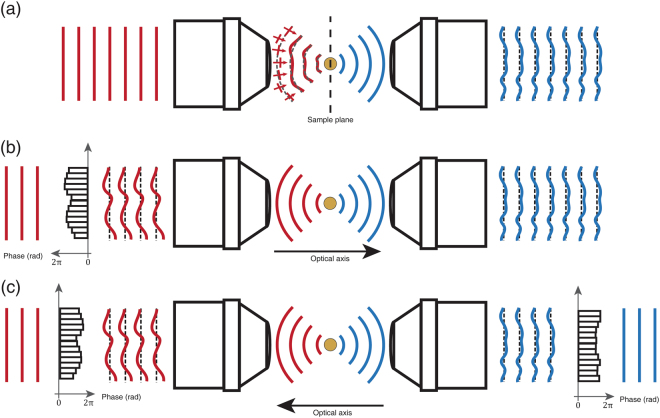
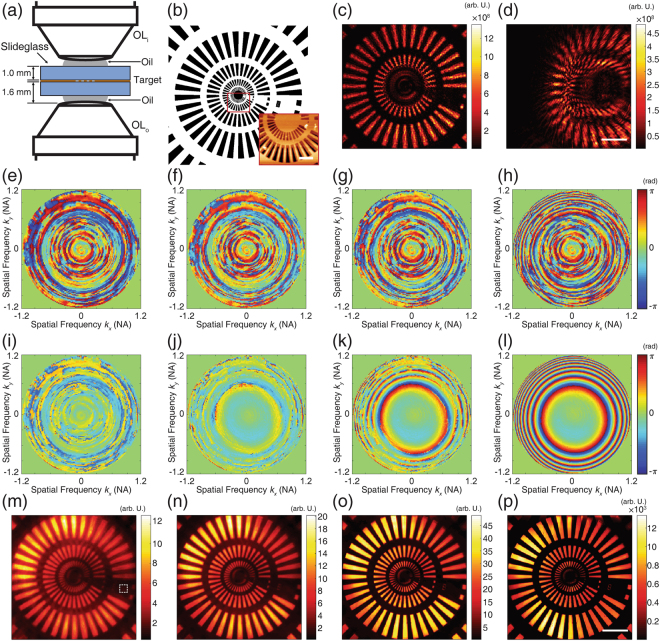
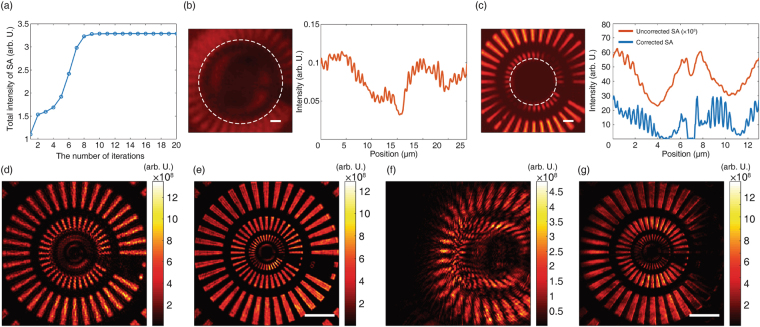
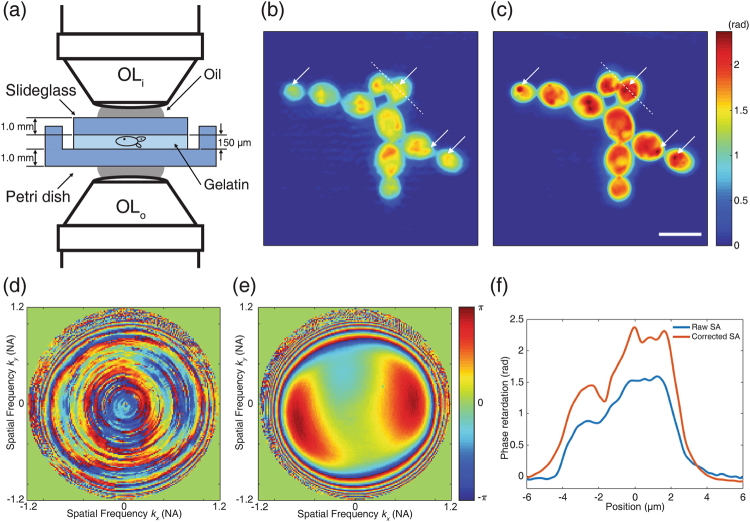
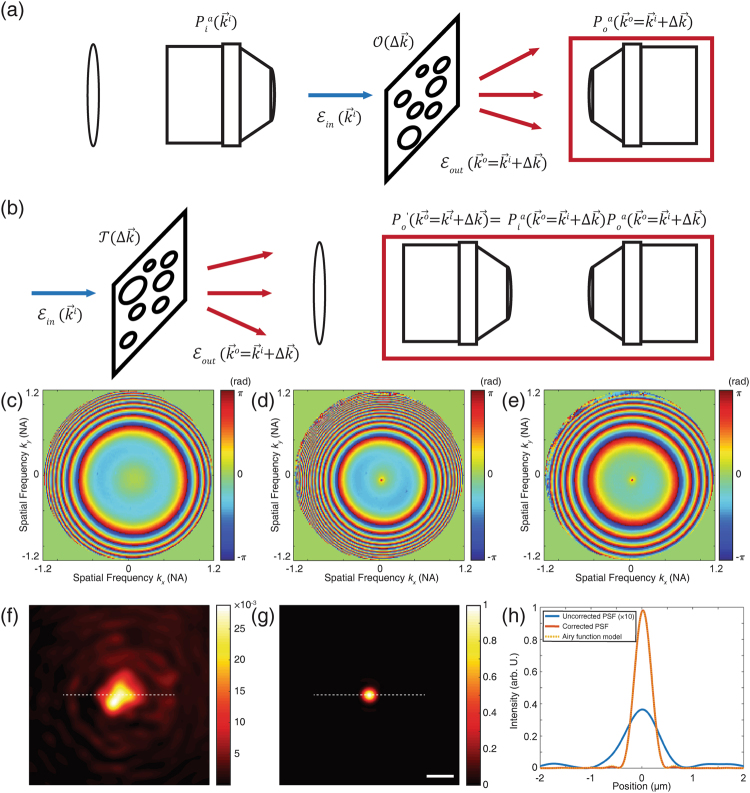
High-resolution optical imaging within thick objects has been a challenging task due to the short working distance of conventional high numerical aperture (NA) objective lenses. Lenses with a large physical diameter and thus a large aperture, such as microscope condenser lenses, can feature both a large NA and a long working distance. However, such lenses suffer from strong aberrations. To overcome this problem, we present a method to correct the aberrations of a transmission-mode imaging system that is composed of two condensers. The proposed method separately identifies and corrects aberrations of illumination and collection lenses of up to 1.2 NA by iteratively optimizing the total intensity of the synthetic aperture images in the forward and phase-conjugation processes. At a source wavelength of 785 nm, we demonstrated a spatial resolution of 372 nm at extremely long working distances of up to 1.6 mm, an order of magnitude improvement in comparison to conventional objective lenses. Our method of converting microscope condensers to high-quality objectives may facilitate increases in the imaging depths of super-resolution and expansion microscopes.


Conflict of interest statement

The authors declare no competing interests.

Figures

Figure 1
Figure 1
Schematic diagram of a transmission-mode off-axis interference microscope. A pair of oil-immersion type condenser lenses (OLi and OLo) shown in the inset were used as objective lenses. Samples were placed between the two condensers. LD: laser diode, BS1-2: beam splitters, GM: 2-axis galvanometer mirror, L1-3: lenses, OLi: condenser for input (illumination), SP: sample plane, OLo: condenser for output (detection), G: grating, SF: spatial filter, sCMOS: camera.
Figure 2
Figure 2
Principle of closed-loop accumulation of single scattering (CLASS) algorithm in the presence of system aberration. (a) A plane wave (red solid lines) is illuminated on the pupil of the input condenser lens. Due to condenser aberration, the plane wave at the sample plane (red curved lines) acquires a different phase shift. This yields a blurred and distorted PSF. In the transmission side (blue curves), the ideal point source appears to be a distorted plane wave after transmitting through the output condenser lens. (b) By placing a virtual SLM at the Fourier plane to compensate for the additional phase shift at different angles (graph with black bars), the back aperture of the input condenser is illuminated by a distorted plane wave. Due to this initial phase shift, the light focused at the sample plane forms a clean PSF. (c) Here, the direction of propagation (optical axis) is reversed numerically by phase-conjugation. In a reversal of the previous process, a virtual SLM (graph with black bars on the right) is placed at the output pupil to focus light at the sample plane to compensate for output aberration.
Figure 3
Figure 3
Application of CLASS algorithm to imaging a custom fabricated Siemens star resolution target. (a) Schematic of sample geometry. The target was fabricated on a slide glass and covered by another slide glass. Total sample thickness was about 2 mm. OLi: condenser for illumination, OLo: condenser for detection. (b) Diagram of the Siemens star target. Inset: an atomic force microscope (AFM) image of red squared region. Scale bar in AFM image, 2 µm. (c) Intensity of holographic phase image for the normal illumination. (d) Intensity of holographic image with oblique illumination. In this particular image, the illumination’s in-plane spatial frequency is approximately 1.0k0. For (c,d), scale bar, 10 µm. (eh) Evolution of correction function for input aberration after first, third, fifth, and 15th iteration, respectively. Color bar, phase in radians. (il) Evolution of measured output aberration after the same respective numbers of iterations. (mp) Intensity of synthetic aperture image after the same respective numbers of iterations. For each image, the color bar is normalized by the mean intensity of pixels in the white squared region in (m). Note the enhancement of maximum intensity after 15 iterations. Scale bar, 10 µm.
Figure 4
Figure 4
Analysis of convergence of CLASS algorithm and resolution enhancement. (a) Total intensity of synthetic aperture image observed during the iterative process. The total intensity converges after about ten iterations. (b) Left side, central 5 × 5 µm2 area of the synthetic aperture image before aberration correction. Scale bar, 500 nm. Right side, the line profile along the white dashed line. The periodicity of the measured pattern is 898 nm. (c) Left side, central 5 × 5 µm2 area of aberration-corrected synthetic aperture image. Right side, line profiles of the two synthetic aperture images with and without aberration correction. Scale bar, 500 nm. The line profiles are extracted from the pixels indicated by a white dashed line. The intensity of the uncorrected synthetic aperture image is multiplied by 103 for better visualization. (d) Intensity of single-shot holographic image of the target with normal illumination. (e) Same image after applying the correction function for output aberration. Note that, unlike in the original image, the second finest patterns are now resolvable. (f) Distorted single-shot image of the obliquely illuminated target. Note that right-side region of the target has moved out of the field-of-view (FOV) due to system aberration. (g) By applying the same output correction function, the distortion-free image can be restored. The pattern that originally translated out of the FOV is dark. Scale bar, 10 µm.
Figure 5
Figure 5
Phase contrast image of yeasts with in-situ aberration correction. (a) Schematic of the sample geometry. Yeast cells were embedded in a gelatin block of 150 µm thickness. The block is placed on a petri dish and covered by a slide glass. The thicknesses of the dish bottom and the slide glass are both 1 mm. OLi: condenser for illumination, OLo: condenser for detection. (b) Phase map of uncorrected synthetic aperture image. (c) Phase map of aberration-corrected synthetic aperture image. Scale bar, 10 µm. Color bar, phase in radians. We used the same color bar for these two images. (d–e) Measured correction functions for the input and output aberration. Color bar, phase in radians. (f) Line profiles of phase retardation along the white dashed lines in (b) and (c).
Figure 6
Figure 6
Separation of input aberration and uncontrolled drift and the effect of input aberration on PSF. (a) Ordinary measurement configuration. The target is placed at the sample plane. The measured output aberration is equal to the aberration of the imaging condenser (marked by the red box). (b) A test target is placed at the image plane before the illumination condenser lens. The measured output aberration in this configuration corresponds to the combined aberration of the two condenser lenses. (c) Measured output aberration by placing the target at the sample plane, i.e., the configuration in (a). (d) Measured output aberration from a test target placed at the image plane before the illumination condenser, i.e. the configuration in (b). (e) Subtracted aberration map, (c) from (d). This corresponds to the input aberration originating from the illuminating condenser lens. (f) Intensity of PSF simulated from the transmission matrix with input aberration in place. To single out the effect of input aberration, only uncontrolled drift and output aberration are corrected numerically. (g) Intensity of PSF simulated from the aberration-free transmission matrix. Scale bar, 1 µm for both images. The two images are normalized to make the maximum intensity of aberration-free PSF unity. (h) Line profiles along the white dashed lines in the PSF images. The intensity of the PSF with input aberration is amplified 10-fold for better visualization. The PSF with input aberration correction is well described by an Airy function model (yellow dashed line). Note that the peak intensity is enhanced 34.7 times (inverse of Strehl ratio) by correcting for input aberration.

Similar articles

Cited by

References

    1. Hell, S. W. & Wichmann, J. Breaking the diffraction resolution limit by stimulated emission: stimulated-emission-depletion fluorescence microscopy. Optics Letters19 (1994). - PubMed
    1. Betzig E, et al. Imaging intracellular fluorescent proteins at nanometer resolution. Science. 2006;313:1642–1645. doi: 10.1126/science.1127344. - DOI - PubMed
    1. Rust MJ, Bates M, Zhuang X. Sub-diffraction-limit imaging by stochastic optical reconstruction microscopy (STORM) Nat Methods. 2006;3:793–795. doi: 10.1038/nmeth929. - DOI - PMC - PubMed
    1. Huang B, Wang W, Bates M, Zhuang X. Three-dimensional super-resolution imaging by stochastic optical reconstruction microscopy. Science. 2008;319:810–813. doi: 10.1126/science.1153529. - DOI - PMC - PubMed
    1. Juette MF, et al. Three-dimensional sub-100 nm resolution fluorescence microscopy of thick samples. Nat Methods. 2008;5:527–529. doi: 10.1038/nmeth.1211. - DOI - PubMed

Publication types

LinkOut - more resources