. 2018 Aug;410(20):5019-5031.
doi: 10.1007/s00216-018-1153-0. Epub 2018 Jun 16.

Strain-level typing and identification of bacteria - a novel approach for SERS active plasmonic nanostructures

Affiliations

Strain-level typing and identification of bacteria - a novel approach for SERS active plasmonic nanostructures

Evelin Witkowska et al. Anal Bioanal Chem. 2018 Aug.

Abstract

One of the potential applications of surface-enhanced Raman spectroscopy (SERS) is the detection of biological compounds and microorganisms. Here we demonstrate that SERS coupled with principal component analysis (PCA) serves as a perfect method for determining the taxonomic affiliation of bacteria at the strain level. We demonstrate for the first time that it is possible to distinguish different genoserogroups within a single species, Listeria monocytogenes, which is one of the most virulent foodborne pathogens and in some cases contact with which may be fatal. We also postulate that it is possible to detect additional proteins in the L. monocytogenes cell envelope, which provide resistance to benzalkonium chloride and cadmium. A better understanding of this infectious agent could help in selecting the appropriate pharmaceutical product for enhanced treatment. Graphical abstract ᅟ.

Keywords: Bacteria detection; Bacteria identification; BcrB; BcrC; CadA1; CadA2; Listeria monocytogenes; PCA; SERS; Strain level discrimination; bcrABC.


Conflict of interest statement

The authors declare that they have no conflict of interests.

Figures

Graphical abstract
Graphical abstract
Fig. 1
Fig. 1
Simplified scheme of the experiment, part I. The color of the dot on each sample indicates a specific genoserogroup: black- group IIa, yellow- group IIc, and pink- group IVb
Fig. 2
Fig. 2
Simplified scheme of the experiment, part II. The pink color of the dot on each sample indicates the genoserogroup IVb
Fig. 3
Fig. 3
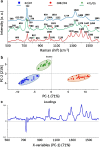
Average SERS spectra (a), PCA scores (b), and loadings (c) of three L. monocytogenes control strains (02/07, 2082/03, 475/05), all sensitive to BC and Cd2+, from three different genoserogroups, filtered from saline solution and recorded on Ag:Au SERS platforms. For all spectra the excitation wavelength was at 785 nm, laser power at 0.5 mW, and acquisition time 45 s. Each SERS spectrum was averaged from at least 25 measurements at different points of the SERS platform
Fig. 4
Fig. 4
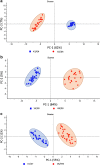
PCA of two L. monocytogenes strains containing: (a) cadA1 gene (43/04 and 82/04) from different genoserogroups (IIa and IVb); (b) cadA2 gene (16/09 and 06/09) from different genoserogroups (IVb and IIc), and (c) both cadA2 and bcrABC genes (01/07 and 06/09S) from different genoserogroups (IVb and IIa). For all spectra the excitation wavelength was at 785 nm, laser power at 0.5 mW, and acquisition time 45 s. Each SERS spectrum was averaged from at least 25 measurements at different sites of the SERS
Fig. 5
Fig. 5
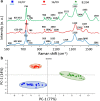
Average SERS spectra (a) and PCA (b) of three L monocytogenes strains from one genoserogroup (IVb) filtered from saline solution and recorded on Ag:Au SERS platforms; PCA of two L monocytogenes strains: 16/09 and 02/07 (c). For all spectra, the excitation wavelength was at 785 nm, laser power at 0.5 mW, and acquisition time 45 s. Each SERS spectrum was averaged from at least 25 measurements at different points of the SERS platform
Fig. 6
Fig. 6
The average SERS spectra of three L. monocytogenes strains (16/09, 02/0, and 82/04) from one genoserogroup (IVb). For all measurements excitation wavelength was at 785 nm, laser power at 0.5 mW, and acquisition time was 45 s. Each SERS spectrum was averaged from at least 25 measurements at different points of the SERS platform
Fig. 7
Fig. 7
The average SERS spectra (a) and PCA (b) of three L. monocytogenes strains (16/09, 02/07, and 82/04) from one genoserogroup (IVb). Strains 16/09 and 82/04 were cultured on medium supplemented with CdCl2. For all measurements excitation wavelength was at 785 nm, laser power at 0.5 mW, and acquisition time was 45 s. Each SERS spectrum was averaged from at least 25 measurements at different places of the SERS platform

Similar articles

Cited by

References

    1. Kneipp K, Wang Y, Kneipp H, Perelman LT, Itzkan I, Dasari RR, Feld MS. Single molecule detection using surface-enhanced raman scattering (SERS) Phys Rev Lett. 1997;78:1667–1670. doi: 10.1103/PhysRevLett.78.1667. - DOI
    1. Smith E, Dent G. Surface-enhanced Raman scattering and surface-enhanced resonance raman scattering. Modern Raman Spectroscopy – A Practical Approach. Hoboken: Wiley; 2005.
    1. Sägmüller B, Schwarze B, Brehm G, Trachta G, Schneider S. Identification of illicit drugs by a combination of liquid chromatography and surface-enhanced Raman scattering spectroscopy. J Mol Struct. 2003;661–662:279–290. doi: 10.1016/S0022-2860(03)00507-6. - DOI
    1. Xu L-J, Lei Z-C, Li J, Zong C, Yang CJ, Ren B. Label-free surface-enhanced Raman spectroscopy detection of DNA with single-base sensitivity. J Am Chem Soc. 2015;137:5149–5154. doi: 10.1021/jacs.5b01426. - DOI - PubMed
    1. Shanmukh S, Jones L, Driskell J, Zhao Y, Dluhy R, Tripp RA. Rapid and sensitive detection of respiratory virus molecular signatures using a silver nanorod array SERS substrate. Nano Lett. 2006;6:2630–2636. doi: 10.1021/nl061666f. - DOI - PubMed

MeSH terms

Substances