. 2018 Nov 15;102(4):821-829.
doi: 10.1016/j.ijrobp.2018.06.003. Epub 2018 Jun 13.

An Automated Multiparametric MRI Quantitative Imaging Prostate Habitat Risk Scoring System for Defining External Beam Radiation Therapy Boost Volumes

Affiliations

An Automated Multiparametric MRI Quantitative Imaging Prostate Habitat Risk Scoring System for Defining External Beam Radiation Therapy Boost Volumes

Radka Stoyanova et al. Int J Radiat Oncol Biol Phys. .

Abstract

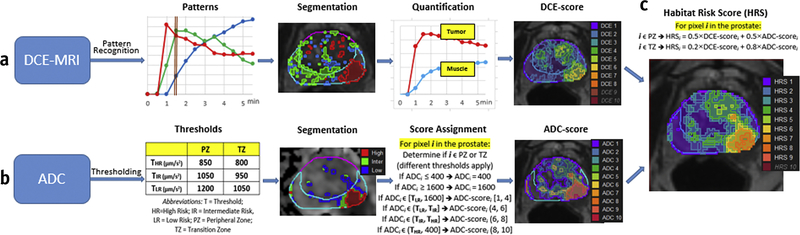
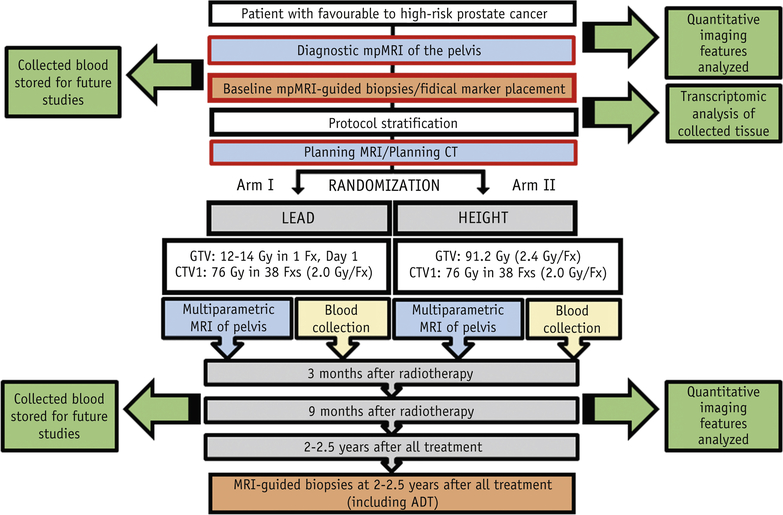
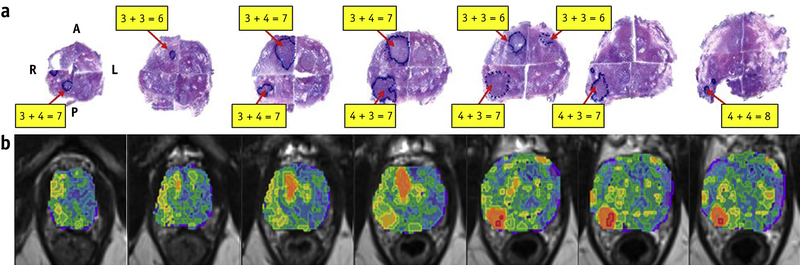
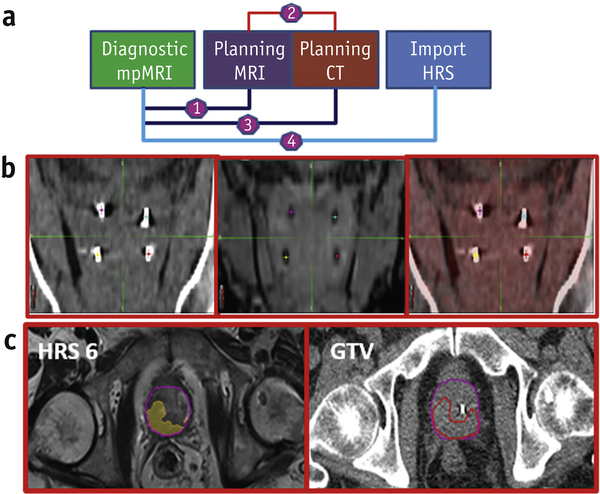
Purpose: To develop a prostate tumor habitat risk scoring (HRS) system based on multiparametric magnetic resonance imaging (mpMRI) referenced to prostatectomy Gleason score (GS) for automatic delineation of gross tumor volumes. A workflow for integration of HRS into radiation therapy boost volume dose escalation was developed in the framework of a phase 2 randomized clinical trial (BLaStM).

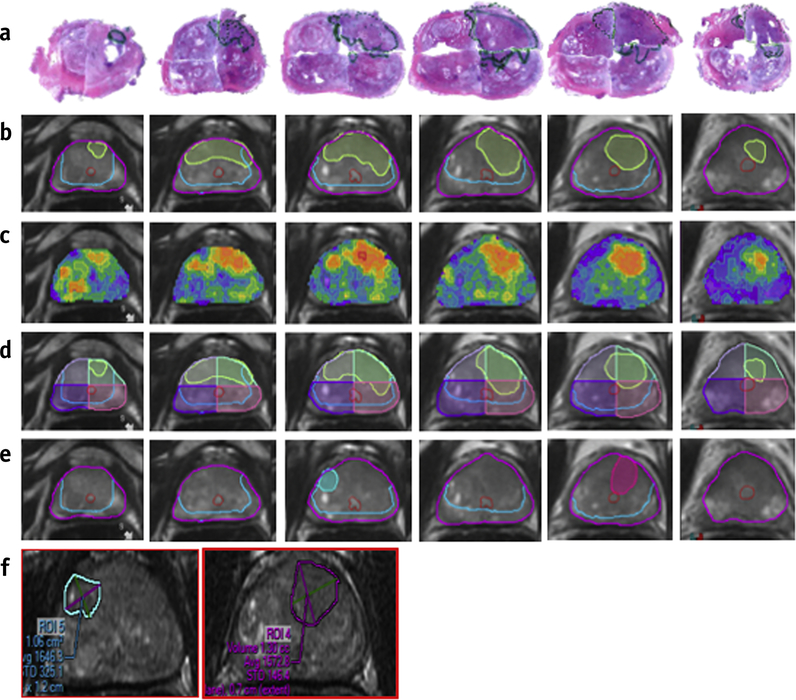
Methods and materials: An automated quantitative mpMRI-based 10-point pixel-by-pixel method was optimized to prostatectomy GSs and volumes using referenced dynamic contrast-enhanced and apparent diffusion coefficient sequences. The HRS contours were migrated to the planning computed tomography scan for boost volume generation.

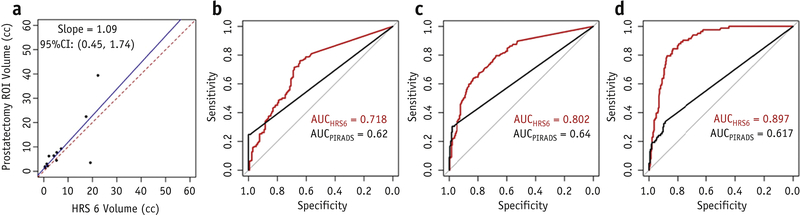
Results: There were 51 regions of interest in 12 patients who underwent radical prostatectomy (26 with GS ≥7 and 25 with GS 6). The resultant heat maps showed inter- and intratumoral heterogeneity. The HRS6 level was significantly associated with radical prostatectomy regions of interest (slope 1.09, r = 0.767; P < .0001). For predicting the likelihood of cancer, GS ≥7 and GS ≥8 HRS6 area under the curve was 0.718, 0.802, and 0.897, respectively. HRS was superior to the Prostate Imaging, Reporting and Diagnosis System 4/5 classification, wherein the area under the curve was 0.62, 0.64, and 0.617, respectively (difference with HR6, P < .0001). HRS maps were created for the first 37 assessable patients on the BLaStM trial. There were an average of 1.38 habitat boost volumes per patient at a total boost volume average of 3.6 cm3.

Conclusions: An automated quantitative mpMRI-based method was developed to objectively guide dose escalation to high-risk habitat volumes based on prostatectomy GS.


Conflict of interest statement

Conflict of Interest: None

Figures

Figure 1.
Figure 1.. Flow-chart of Habitat Risk Score (HRS) construction.
(a) DCE-MRI analysis: </p>DCE-MRI data is baseline corrected by the average of δ = 2 pre-contrast points. Non Negative Matrix Factorization (NMF) is applied to the matrix D(X, t) with κ=3. D is represented as a product of κ basic temporal contrast signatures S(t) and their weights W(X), i.e. D ~W × S. The identified three basic temporal contrast signatures S(t) are shown in box, labelled Patterns; the well perfused pattern, Swp (depicted in red) is automatically selected as the pattern with maximum area under the curve (AUC) between 0 and 90 sec (brown bar). The segmented weights of the patterns W(t) are shown in corresponding colors in box, labelled Segmentation (α=60, β=10). The area in red depicts the region of interest (ROI) for the well-perfused pattern: ROIwp. Two curves are shown in box, labelled Quantification: the average DCE-curve from the ROIwp (Tumor) and Gluteus Maximus (Muscle). Semi-quantitative feature (Late AUC) is extracted from these two curves: Σi (Tumor) and Σim (Muscle). The ratio Σiim is propagated for each pixel in the prostate, using Wwp. A value between 1 to 10 is assigned to each pixel of the prostate, using σ1=.5 and σ2=2.5 (the range is bound by the γth and (100-γ)th; γ=5). DCE-score is depicted as a heat map (Note that DCE9 and DCE10 are empty contours). (b) ADC analysis: Thresholds ΤHR, TIR and TLR for volumes at high risk, intermediate risk and low risk for cancer are identified separately for peripheral zone (PZ) and transition zone (TZ). The segmented volumes are shown in box, labelled Segmentation. The ADC is mapped on 10-point scale, using the rules in Score Assignment box and depicted as a heat map. (c) HRS is calculated for each pixel, using η1= 0.5 and η2= 0.5 in PZ and η1= 0.2 and η2 =0.8 in TZ. HRS is depicted as a heat map (Note that HRS10 is an empty contour).
Figure 2.
Figure 2.. Schema of approach for correlating histopathology with Habitat Risk Score (HRS) and PIRADS.
(a) stitched quantrantized prostatectomy H&E-stained histopathology sections. (b) Corresponding T2-weighted MRI transverse slices with contours of the prostate (magenta), urethra (red), peripheral zone (PZ) (light blue) and tumor nodules from histopathology, mapped in light green; (c) HRS represented as heat-map, overplayed on the T2w; (d) quadrants overlays (last row); (e) PIRADS areas are transferred from radiologists drawn contours (f).
Figure 3.
Figure 3.. Schema of the BLaStM Phase II randomized clinical trial.
“MRI-Guided Prostate Boosts Via Initial Lattice Stereotactic vs Daily Moderately Hypofractionated Radiotherapy (BLaStM), http://clinicaltrials.gov: NCT02307058.
Figure 4.
Figure 4.. HRS performance.
(a) Correlation of HRS6 volumes with prostatectomy ROI volumes with GS≥7; ROC curves of PIRADS and HRS6 in discriminating: (b) Cancer vs No Cancer; (c) GS≥7 vs No Cancer or GS=6; and (d) GS≥8 vs No cancer or GS=6,7.
Figure 5:
Figure 5:. Correlation of habitat risk score (HRS) maps with histopathology.
(a) Pseudowhole mount H&E-stained histopathology sections. The consecutive axial slices are displayed from apex (left) to base (right). Tumor nodules are labeled with the corresponding Gleason Score (GS). The right posterior nodule displays heterogeneity with GS increasing from 3+4=7, to 4+3=7, and then to 4+4=8 (apex to base). The GS of the right anterior tumor nodule changes from 3+3=6 to 3+4=7 and back to 3+3=6; (b) Corresponding HRS maps, displayed on axial T2w slices. Image data was resampled at the same spacing (0.3 to 0.4 cm) as the histopathology specimens. The red color intensities of the heat-map are associated with the higher microscopic GS. Abbreviations: A = anterior; L = left; P = posterior; R = right
Figure 6:
Figure 6:. Workflow for incorporation of HRS in BLaStM patient RT planning.
(a) Schematic of the registrations utilized and the migration of the HRS structures: (1) Using prostate anatomical matching, the diagnostic mpMRI is registered with the planning MRI; (2) The planning MRI is fused to the planning CT, using fiducial matching; (3) Using (1) and (2), the diagnostic mpMRI generated HRS contours are migrated to the planning CT; (b) Registration of the planning CT (left) and planning MRI (center) using fiducial matching and the alignment (right); (c) The final result for one patient is displayed where the HRS 6 contour has been migrated to the planning CT using the methods described.

References

    1. Morris WJ, Tyldesley S, Rodda S, et al. Androgen Suppression Combined with Elective Nodal and Dose Escalated Radiation Therapy (the ASCENDE-RT Trial): An Analysis of Survival Endpoints for a Randomized Trial Comparing a Low-Dose-Rate Brachytherapy Boost to a Dose-Escalated External Beam Boost for High- and Intermediate-risk Prostate Cancer. Int J Radiat Oncol Biol Phys. 2017;98(2):275–85. - PubMed
    1. Bauman G, Haider M, Van der Heide UA, Menard C. Boosting imaging defined dominant prostatic tumors: a systematic review. Radiother Oncol. 2013;107(3):274–81. - PubMed
    1. Lips IM, van der Heide UA, Haustermans K, et al. Single blind randomized phase III trial to investigate the benefit of a focal lesion ablative microboost in prostate cancer (FLAME-trial): study protocol for a randomized controlled trial. Trials. 2011;12:255. - PMC - PubMed
    1. von Eyben FE, Kiljunen T, Kangasmaki A, et al. Radiotherapy Boost for the Dominant Intraprostatic Cancer Lesion-A Systematic Review and Meta-Analysis. Clin Genitourin Cancer. 2016;14(3):189–97. - PubMed
    1. Isebaert S, Van den Bergh L, Haustermans K, et al. Multiparametric MRI for prostate cancer localization in correlation to whole-mount histopathology. J Magn Reson Imaging. 2013;37(6):1392–401. - PubMed

Publication types