. 2018 Sep:114:90-108.
doi: 10.1016/j.bone.2018.06.009. Epub 2018 Jun 13.

Hydrogen sulfide epigenetically mitigates bone loss through OPG/RANKL regulation during hyperhomocysteinemia in mice

Affiliations

Hydrogen sulfide epigenetically mitigates bone loss through OPG/RANKL regulation during hyperhomocysteinemia in mice

Jyotirmaya Behera et al. Bone. 2018 Sep.

Abstract

Hydrogen sulfide (H2S) is a novel gasotransmitter produced endogenously in mammalian cells, which works by mediating diverse physiological functions. An imbalance in H2S metabolism is associated with defective bone homeostasis. However, it is unknown whether H2S plays any epigenetic role in bone loss induced by hyperhomocysteinemia (HHcy). We demonstrate that diet-induced HHcy, a mouse model of metabolite induced osteoporosis, alters homocysteine metabolism by decreasing plasma levels of H2S. Treatment with NaHS (H2S donor), normalizes the plasma level of H2S and further alleviates HHcy induced trabecular bone loss and mechanical strength. Mechanistic studies have shown that DNMT1 expression is higher in the HHcy condition. The data show that activated phospho-JNK binds to the DNMT1 promoter and causes epigenetic DNA hyper-methylation of the OPG gene. This leads to activation of RANKL expression and mediates osteoclastogenesis. However, administration of NaHS could prevent HHcy induced bone loss. Therefore, H2S could be used as a novel therapy for HHcy mediated bone loss.

Keywords: Bone loss; DNA methyltransferase; Epigenetic DNA methylation; Osteoblastogenesis; Osteoclastogenesis.


Conflict of interest statement

Conflict of interest

All authors declare no conflict of interest.

Figures

Figure 1
Figure 1. Diet-induced Hyperhomocysteinemia (HHcy) alters normal homocysteine metabolism and hydrogen sulfide (H2S) production
(A and B) mRNA expression of mouse CBS and CSE in total BM cells. (C and D) mRNA expression of CBS and CSE in BMMSCs. (E and F) Protein western blot analysis of CBS and CSE in the experimental group. (G) CBS activity of the experimental groups. (H, I and J) Levels of SAM, SAH and the SAM/SAH ratio was estimated by ELISA. (K and L) Protein western blot analysis of Hcy expression. (M) Plasma-derived tHcy. (N) Plasma-derived H2S after 6 weeks of supplemented HMD. Data are expressed as mean ± SEM. n = 7 mice per group. *p < 0.05 compared with the wild-type (WT) mice. See also Figure S1 and S2.
Figure 2
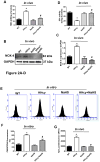
Figure 2. Effect of NaHS on HMD induced HHcy-mediated oxidative stress in mice
(A) Lipid peroxidation level in the bone marrow plasma was assessed by MDA assay. (B) Representative Western blot analysis for NOX-4 protein and GAPDH control. (C) Densitometry analysis of NOX-4 protein expression as represented in the bar diagram (D) Cellular antioxidant enzyme GPx activity. (E, F) Flow cytometry analysis of Reactive Oxygen Species (ROS) using CM-H2DCFDA fluorescent dye in BMMSCs. (F) Densitometry analysis of ROS fluorescence represented in the bar diagram (G) Bar diagram represents quantification of H2O2 production in the experimental group. WT (label as WT), HMD-fed mice (label as HHcy), WT+NaHS (label as NaHS) and HMD+NaHS (label as HHcy+NaHS). Data represented as mean ± SEM from n =7 mice per group. *p < 0.05 compared with the wild-type (WT) mice, #p < 0.05 compared with the HHcy mice.
Figure 3
Figure 3. NaHS ameliorated HHcy-induced RANKL synthesis via c-Jun/JNK signaling
(A) In Vitro BMMSCs culture supernatant derived OPG and secreted RANKL level was measured by ELISA, treated with increasing dosage concentrations of Hcy (0–3mM). The RANKL level was upregulated by increasing the concentration of Hcy. However, the OPG level was down-regulated by increasing the dosage concentration of Hcy. (B) Time-dependent study of Hcy exposure (3mM) to BMMSCs culture shows an increase in secreted RANKL (sRNAKL) level in culture supernatants. However, combination treatment of Hcy with NaHS (100 μM) reverses the Hcy effect, as measured by ELISA. (C) Representative Western blot analysis for RANKL, OPG proteins and GAPDH control. (D) Densitometry analysis of RANKL and OPG protein expression as represented in the bar diagram. (E) Bar diagram represents quantification of phosphorylation of JNK was determined by JNK (Thr183/Tyr185). (F) Bar diagram represents quantification of sRANKL levels in plasma (G) Bar diagram represents the quantification OPG level in plasma were estimated in by ELISA. Plasma isolated from WT (label as WT), HMD-fed mice (label as HHcy), WT+NaHS (label as NaHS), HMD+NaHS (label as HHcy+NaHS), HMD+SP600125 (label as HHcy+ SP600125 and HMD+ N-acetyl cysteine (label as HHcy+NAC). Data are expressed as mean ± SEM. n = 7 mice per group. *p < 0.05 compared with the wild-type (WT) mice, #p < 0.05 compared with the HHcy mice. See also Figure S3.
Figure 4
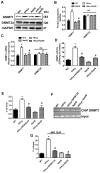
Figure 4. Effect of NaHS on HHcy induced DNMT1 expression via JNK mediated transcriptional gene regulation and its effects in the OPG/RANKL promoter methylation pattern
Representative Western blot analysis for DNMT-1, DNMT3A proteins and GAPDH control. (B) Densitometry analysis of DNMT1 and DNMT3A protein expression as represented in the bar diagram. (C) qRT-PCR analysis of DNMT-1 and DNMT-3A mRNA expression levels as represented in a bar graph. (D) DNMT activity in BMMSCs nuclear extract samples expressed in OD per hour per milligram (mg) of protein represented in a bar graph. (E) Bar graph representing global DNA methylation status by %5-mC detected in different mouse BMMSCs genomic DNA samples. (F) PCR gel of DNMT ChIP assay. (G) Bar graph plot of ChIP results after JNK transcriptionally regulates DNMT1 expression by promoter binding in BMMSCs of experimental mice treated with NaHS and JNK inhibitor SP600125. (H) Representing PCR gel image of methylation (M) and un-methylated (U) shows that methylation changes at the promoter of candidate genes (OPG and RANKL) in experimental mice treated with NaHS and JNK inhibitor SP600125. (I) Bar diagram represents quantification of sRANKL levels in plasma after 5-Azacytidine treatment measured by ELISA. Data are expressed as mean ± SEM. n = 7 mice per group. *p < 0.05 compared with the wild-type (WT) mice, #p < 0.05 compared with the HHcy mice. See also Figure S3.
Figure 5
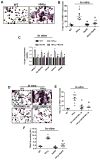
Figure 5. NaHS decreased HHcy induced osteoclastogenesis in vitro
(A to F) BM cells were collected from WT mice and plated under 15% CM from WT and HHcy BMMSCs. (A) Day 5 TRAP-stained mature osteoclasts. (B) Quantitative analysis was showing the number of TRAP+ mature osteoclast (n = 7). (C) Total RNA was isolated from mature osteoclast cultures, and gene expression analysis for the indicated genes. (D) CM from HHcy-induced BMMSCs was pre-treated with a neutralizing antibody recognizing RANKL or an immunoglobulin G (IgG) control antibody (Ab). Day 5 mature osteoclasts were TRAP-stained and the number of osteoclasts was quantified (n = 7). (E) Bar diagram represents quantification of TRAP positive osteoclast (F) Bar diagram represents quantification of TRAP5b activity under HHcy. WT (label as WT), HMD-fed mice (label as HHcy), WT+NaHS (label as NaHS), HMD+NaHS (label as HHcy+NaHS). Data represented mean ± SEM from n =7 per group. *p < 0.05 compared with the wild-type (WT) mice and #p < 0.05 compared with the HHcy mice.
Figure 6
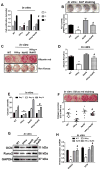
Figure 6. NaHS increases osteogenesis in HHcy in vitro
(A) In Vitro cell proliferation assay was measured by MTT method in BMMSCs culture in day dependent manner. Cell proliferation was low in HHcy culture in compared to WT. (B) Representative image and quantitative analysis for ALP staining of the BMMSCs culture after on day 6 under osteogenic medium. (C) Representative images of osteogenic bone mineralization assay (top panel with alizarin red staining and lower panel with Von Kossa staining) of BMMSCs after day 14. (D) Quantitative analysis for bone mineralization (Alizarin red assay) of the BMMSCs on day 14. (E) Bar diagram represents quantification of calcium deposition was measured in BMMSCs using calcium calorimetric assay kit. (F) Representative image and quantitative analysis for collagen secretion (Sirius red assay) of the BMMSCs after day 14. (G) Representative Western blot analysis for OCN, Runx2 proteins and GAPDH control. (H) Densitometry analysis of OCN and Runx2 protein expression as represented in the bar diagram. (I) mRNA expression of osteogenic marker genes (Runx2 and OCN). Data are expressed as mean ± SEM. n = 7 mice per group. *p < 0.05 compared with the wild-type (WT) mice, #p < 0.05 compared with the HHcy mice.
Figure 7
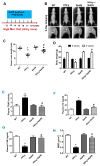
Figure 7. Pharmacological administration of NaHS prevents HHcy-induced trabecular bone loss in vivo
(A) H2S donor NaHS was i.p. injected to HHcy mice every day for 6-weeks (10mg/kg/wt). After the last injection, the samples were harvested for additional experiments. (B) Representative X-ray images of the experimental mice. Arrows illustrate that NaHS increases bone density in femur (FROI, femur region of interest). (C) Bar diagram represents quantification of Femur length of the experimental mice. (D) Bar diagram represents quantification of Body weight was followed before (0-weeks) and after post feeding HMD diet (6-weeks) in the experimental group. HHcy mice show a significantly lower in body weight as compared with controls (n=7 per group). (E) Bar diagram represents quantification of Plasma TRAP5b activity, a specific marker of osteoclast activity in experimental mice. (F) Bar diagram represents quantification of Plasma CTX level, a marker of bone resorption. (G) Bar diagram represents quantification of Plasma P1NP level, a marker of bone formation. (H) Bar diagram represents quantification of BMD of the experimental mice. (I) Representative μCT cross-sectional images of distal femurs were demonstrating bone phenotypes. (J–M) Corresponding μCT measurements showed high trabecular bone mass phenotypes. Bone volume fraction (BV/TV) (%), trabecular number (Tb.N) (mm 1), trabecular thickness (Tb.Th.) (μm) and trabecular separation (Tb.Sp.) (μm) and (N) Femur trabecular bone volume, as shown by H&E staining in experimental mice.(O) Bar diagram represents quantification of H&E staining using Image J software. (P and Q) the representative bar graph shows the biomechanical quality of the femurs in mice. (P) Effect of NaHS on the ultimate load of the femur in three-point bending. (Q) The representative bar graph on the stiffness of femurs in three-point bending. Data are expressed as mean ± SEM. n = 7 mice per group. *p < 0.05 compared with the wild-type (WT) mice, #p < 0.05 compared with the HHcy mice.
Fig. 8
Fig. 8
Proposed mechanism for a role of H2S on HHcy induced bone loss. First, HMD fed mice induce HHcy condition by altering normal Hcy metabolism and decreased H2S production. Second, HMD enhanced HHcy condition further activates C-Jun/JNK-p signaling through oxidative stress. However, administration of NaHS (H2S donor) or specific JNK inhibitor (SP600125) reverses this effects in HMD fed mice. Third, activated JNK-p further transcriptionally regulates DNMT1 expression through binding its promoter and, fourth, DNMT1 expression enhances OPG hyper-methylation, leads to BMMSCs-derived osteoblast dysfunction. Fifth, upregulation of RANKL during HHcy can accelerate osteoclastogenesis. Collectively, it causes bone loss during HHcy condition. Administration of DNMT inhibitor 5-Azacytidine reverses this changes.

References

    1. Rodan GA, Martin TJ. Therapeutic approaches to bone diseases. Science. 2000;289:1508–14. - PubMed
    1. Liu HY, Wu AT, Tsai CY, et al. The balance between adipogenesis and osteogenesis in bone regeneration by platelet-rich plasma for age-related osteoporosis. Biomaterials. 2011;32:6773–80. - PubMed
    1. Qi X, Zhang J, Yuan H, et al. Exosomes Secreted by Human-Induced Pluripotent Stem Cell-Derived Mesenchymal Stem Cells Repair Critical-Sized Bone Defects through Enhanced Angiogenesis and Osteogenesis in Osteoporotic Rats. International Journal of Biological Science. 2016;12:836–49. - PMC - PubMed
    1. Verron E, Gauthier O, Janvier P, et al. In vivo bone augmentation in an osteoporotic environment using bisphosphonate-loaded calcium deficient apatite. Biomaterials. 2010;31:7776–84. - PubMed
    1. Rachner TD, Khosla S, Hofbauer LC. Osteoporosis: now and the future. Lancet. 2011;377:1276–87. - PMC - PubMed

Publication types

MeSH terms