

Detection of neural light-scattering activity in vivo: optical transmittance studies in the rat brain
- PMID: 29908312
- PMCID: PMC6069533
- DOI: 10.1016/j.neuroimage.2018.06.039
Detection of neural light-scattering activity in vivo: optical transmittance studies in the rat brain
Abstract
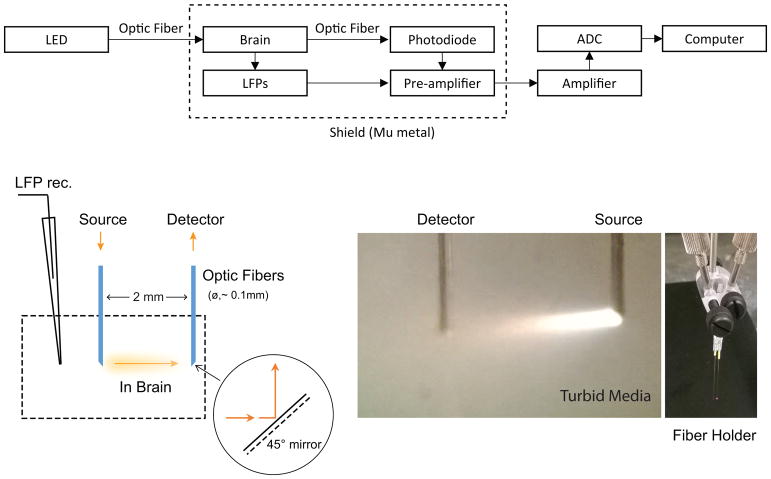
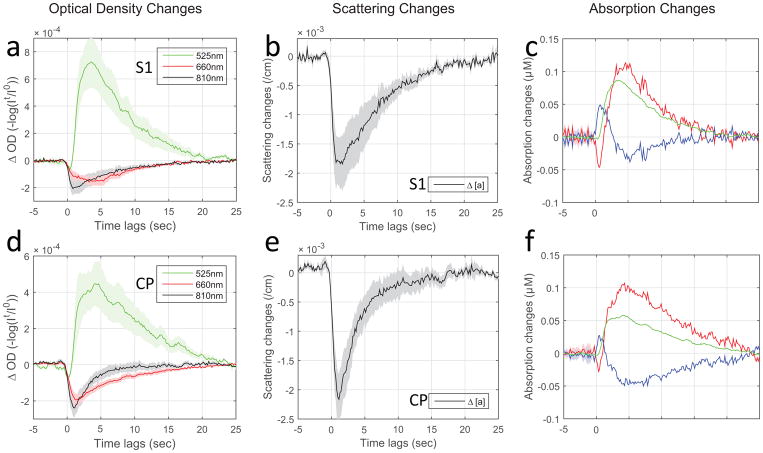
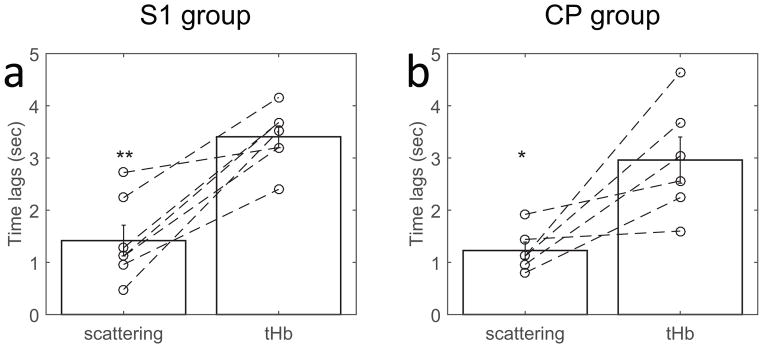
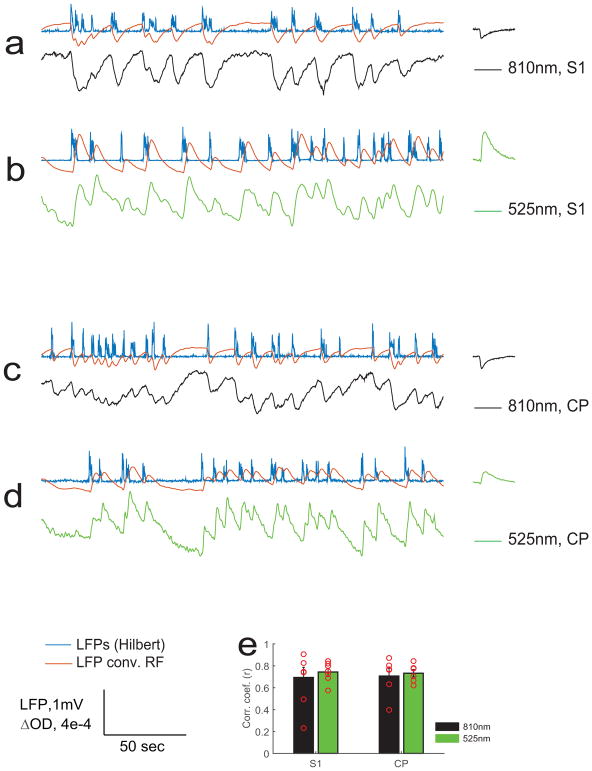
Optical studies of ex vivo brain slices where blood is absent show that neural activity is accompanied by significant intrinsic optical signals (IOS) related to activity-dependent scattering changes in neural tissue. However, the neural scattering signals have been largely ignored in vivo in widely-used IOS methods where absorption contrast from hemoglobin was employed. Changes in scattering were observed on a time scale of seconds in previous brain slice IOS studies, similar to the time scale for the hemodynamic response. Therefore, potential crosstalk between the scattering and absorption changes may not be ignored if they have comparable contributions to IOS. In vivo, the IOS changes linked to neural scattering have been elusive. To isolate neural scattering signals in vivo, we employed 2 implantable optodes for small-separation (2 mm) transmission measurements of local brain tissue in anesthetized rats. This unique geometry enables us to separate neuronal activity-related changes in neural tissue scattering from changes in blood absorption based upon the direction of the signal change. The changes in IOS scattering and absorption in response to up-states of spontaneous neuronal activity in cortical or subcortical structures have strong correlation to local field potentials, but significantly different response latencies. We conclude that activity-dependent neural tissue scattering in vivo may be an additional source of contrast for functional brain studies that provides complementary information to other optical or MR-based systems that are sensitive to hemodynamic contrast.
Keywords: In vivo; Intrinsic optical signal; Neural scattering activity; Neurovascular coupling; Optical transmission measurement.
Copyright © 2018 Elsevier Inc. All rights reserved.
Figures
Similar articles
-
In vitro intrinsic optical imaging can be used for source determination in cortical slices.Eur J Neurosci. 2014 Jan;39(1):72-82. doi: 10.1111/ejn.12384. Epub 2013 Oct 13. Eur J Neurosci. 2014. PMID: 24118173
-
Quantitative In Vivo Imaging of Tissue Absorption, Scattering, and Hemoglobin Concentration in Rat Cortex Using Spatially Modulated Structured Light.In: Frostig RD, editor. In Vivo Optical Imaging of Brain Function. 2nd edition. Boca Raton (FL): CRC Press/Taylor & Francis; 2009. Chapter 12. In: Frostig RD, editor. In Vivo Optical Imaging of Brain Function. 2nd edition. Boca Raton (FL): CRC Press/Taylor & Francis; 2009. Chapter 12. PMID: 26844326 Free Books & Documents. Review.
-
Intrinsic optical signals in rat hippocampal slices during hypoxia-induced spreading depression-like depolarization.J Neurophysiol. 1999 Oct;82(4):1818-31. doi: 10.1152/jn.1999.82.4.1818. J Neurophysiol. 1999. PMID: 10515971
-
Two different mechanisms underlie reversible, intrinsic optical signals in rat hippocampal slices.J Neurophysiol. 2002 Apr;87(4):1924-37. doi: 10.1152/jn.00231.2001. J Neurophysiol. 2002. PMID: 11929912
-
Technologies for imaging neural activity in large volumes.Nat Neurosci. 2016 Aug 26;19(9):1154-64. doi: 10.1038/nn.4358. Nat Neurosci. 2016. PMID: 27571194 Free PMC article. Review.
Cited by
-
Contribution of animal models toward understanding resting state functional connectivity.Neuroimage. 2021 Dec 15;245:118630. doi: 10.1016/j.neuroimage.2021.118630. Epub 2021 Oct 10. Neuroimage. 2021. PMID: 34644593 Free PMC article. Review.
-
Emerging imaging methods to study whole-brain function in rodent models.Transl Psychiatry. 2021 Sep 4;11(1):457. doi: 10.1038/s41398-021-01575-5. Transl Psychiatry. 2021. PMID: 34482367 Free PMC article. Review.
-
Disentangling the impact of cerebrospinal fluid formation and neuronal activity on solute clearance from the brain.Fluids Barriers CNS. 2023 Jun 14;20(1):43. doi: 10.1186/s12987-023-00443-2. Fluids Barriers CNS. 2023. PMID: 37316849 Free PMC article.
-
Laser speckle imaging of the hippocampus.Biomed Opt Express. 2024 Jan 30;15(2):1268-1277. doi: 10.1364/BOE.507371. eCollection 2024 Feb 1. Biomed Opt Express. 2024. PMID: 38404300 Free PMC article.
References
-
- Aitken PG, Fayuk D, Somjen GG, Turner DA. Use of intrinsic optical signals to monitor physiological changes in brain tissue slices. Methods. 1999;18:91–103. - PubMed
-
- Andrew RD, MacVicar BA. Imaging cell volume changes and neuronal excitation in the hippocampal slice. Neuroscience. 1994;62:371–383. - PubMed
-
- Aso T, Urayama S, Poupon C, Sawamoto N, Fukuyama H, Le Bihan D. An intrinsic diffusion response function for analyzing diffusion functional MRI time series. Neuroimage. 2009;47:1487–1495. - PubMed
Publication types
MeSH terms
Grants and funding
LinkOut - more resources
Full Text Sources
Other Literature Sources
