

The Emerging Potential for Network Analysis to Inform Precision Cancer Medicine
- PMID: 29908887
- PMCID: PMC6097914
- DOI: 10.1016/j.jmb.2018.06.016
The Emerging Potential for Network Analysis to Inform Precision Cancer Medicine
Abstract
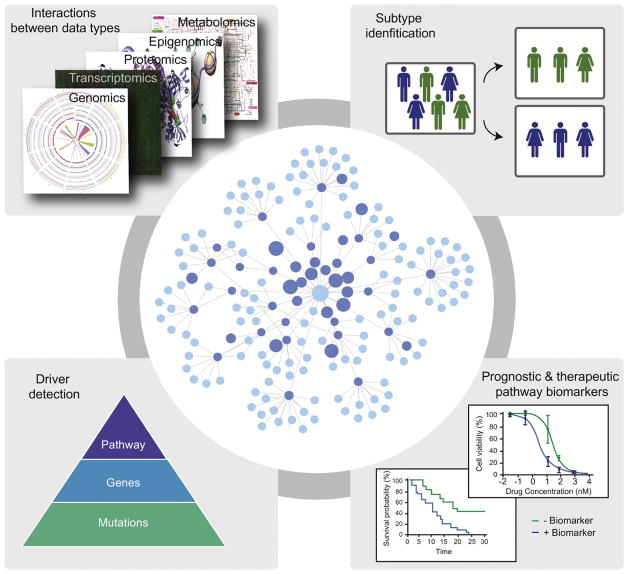
Precision cancer medicine promises to tailor clinical decisions to patients using genomic information. Indeed, successes of drugs targeting genetic alterations in tumors, such as imatinib that targets BCR-ABL in chronic myelogenous leukemia, have demonstrated the power of this approach. However, biological systems are complex, and patients may differ not only by the specific genetic alterations in their tumor, but also by more subtle interactions among such alterations. Systems biology and more specifically, network analysis, provides a framework for advancing precision medicine beyond clinical actionability of individual mutations. Here we discuss applications of network analysis to study tumor biology, early methods for N-of-1 tumor genome analysis, and the path for such tools to the clinic.
Keywords: cancer systems biology; network analysis; precision cancer medicine.
Copyright © 2018 The Authors. Published by Elsevier Ltd.. All rights reserved.
Figures
Similar articles
-
Synthetic Lethal Networks for Precision Oncology: Promises and Pitfalls.J Mol Biol. 2018 Sep 14;430(18 Pt A):2900-2912. doi: 10.1016/j.jmb.2018.06.026. Epub 2018 Jun 20. J Mol Biol. 2018. PMID: 29932943 Free PMC article. Review.
-
Art and Challenges of Precision Medicine: Interpreting and Integrating Genomic Data Into Clinical Practice.Am Soc Clin Oncol Educ Book. 2018 May 23;38:546-553. doi: 10.1200/EDBK_200759. Am Soc Clin Oncol Educ Book. 2018. PMID: 30231369 Review.
-
Statistical Methods for Establishing Personalized Treatment Rules in Oncology.Biomed Res Int. 2015;2015:670691. doi: 10.1155/2015/670691. Epub 2015 Sep 13. Biomed Res Int. 2015. PMID: 26446492 Free PMC article. Review.
-
Precision Medicine in Pediatric Oncology: Translating Genomic Discoveries into Optimized Therapies.Clin Cancer Res. 2017 Sep 15;23(18):5329-5338. doi: 10.1158/1078-0432.CCR-16-0115. Epub 2017 Jun 9. Clin Cancer Res. 2017. PMID: 28600472 Review.
-
Defining, Identifying, and Understanding "Exceptional Responders" in Oncology Using the Tools of Precision Medicine.Cancer J. 2019 Jul/Aug;25(4):296-299. doi: 10.1097/PPO.0000000000000392. Cancer J. 2019. PMID: 31335394 Review.
Cited by
-
uKIN Combines New and Prior Information with Guided Network Propagation to Accurately Identify Disease Genes.Cell Syst. 2020 Jun 24;10(6):470-479.e3. doi: 10.1016/j.cels.2020.05.008. Epub 2020 Jun 24. Cell Syst. 2020. PMID: 32684276 Free PMC article.
-
Network Analysis of Microarray Data.Methods Mol Biol. 2022;2401:161-186. doi: 10.1007/978-1-0716-1839-4_11. Methods Mol Biol. 2022. PMID: 34902128
-
The core symptom in multiple myeloma patients undergoing chemotherapy: a network analysis.Support Care Cancer. 2023 Apr 25;31(5):297. doi: 10.1007/s00520-023-07759-7. Support Care Cancer. 2023. PMID: 37097532 Free PMC article.
-
Molecular Subtyping of Cancer Based on Distinguishing Co-Expression Modules and Machine Learning.Front Genet. 2022 May 2;13:866005. doi: 10.3389/fgene.2022.866005. eCollection 2022. Front Genet. 2022. PMID: 35586568 Free PMC article.
-
Image-Based Network Analysis of DNp73 Expression by Immunohistochemistry in Rectal Cancer Patients.Front Physiol. 2020 Jan 8;10:1551. doi: 10.3389/fphys.2019.01551. eCollection 2019. Front Physiol. 2020. PMID: 31969833 Free PMC article.
References
-
- Pleasance ED, Cheetham RK, Stephens PJ, McBride DJ, Humphray SJ, Greenman CD, Varela I, Lin M-L, Ordóñez GR, Bignell GR, Ye K, Alipaz J, Bauer MJ, Beare D, Butler A, Carter RJ, Chen L, Cox AJ, Edkins S, Kokko-Gonzales PI, Gormley NA, Grocock RJ, Haudenschild CD, Hims MM, James T, Jia M, Kingsbury Z, Leroy C, Marshall J, Menzies A, Mudie LJ, Ning Z, Royce T, Schulz-Trieglaff OB, Spiridou A, Stebbings LA, Szajkowski L, Teague J, Williamson D, Chin L, Ross MT, Campbell PJ, Bentley DR, Futreal PA, Stratton MR. A comprehensive catalogue of somatic mutations from a human cancer genome. Nature. 2010;463:191–6. doi: 10.1038/nature08658. - DOI - PMC - PubMed
Publication types
MeSH terms
Grants and funding
LinkOut - more resources
Full Text Sources
Other Literature Sources
Miscellaneous
