

Altered microRNA regulation of short chain fatty acid receptors in the hypertensive kidney is normalized with hydrogen sulfide supplementation
- PMID: 29909116
- PMCID: PMC6086735
- DOI: 10.1016/j.phrs.2018.06.012
Altered microRNA regulation of short chain fatty acid receptors in the hypertensive kidney is normalized with hydrogen sulfide supplementation
Abstract
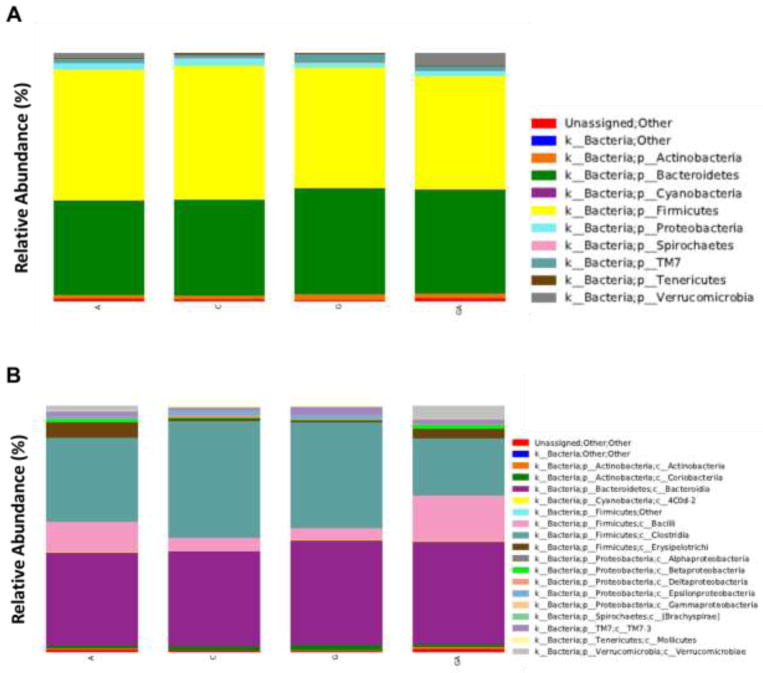
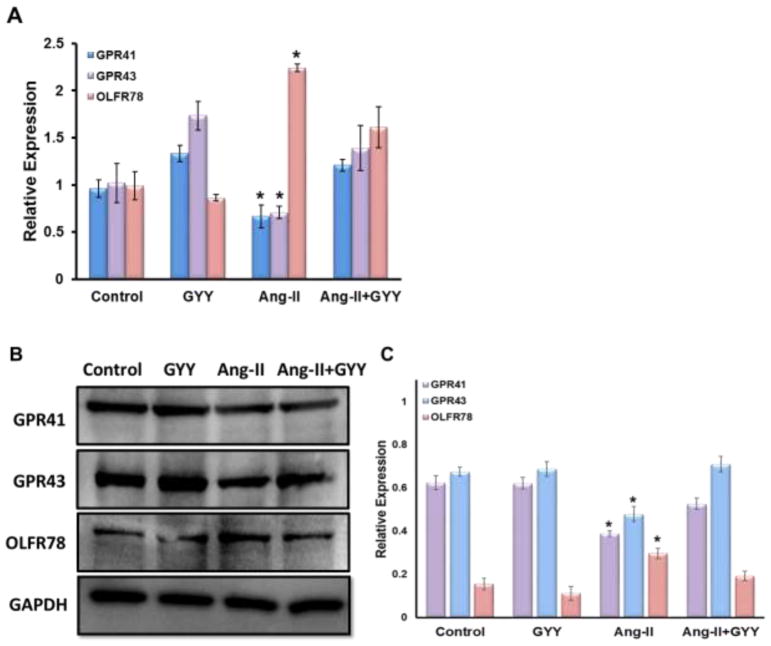
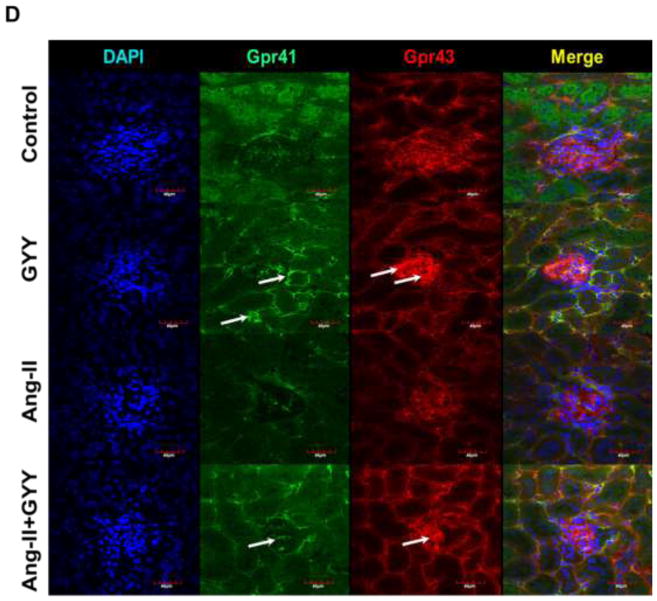
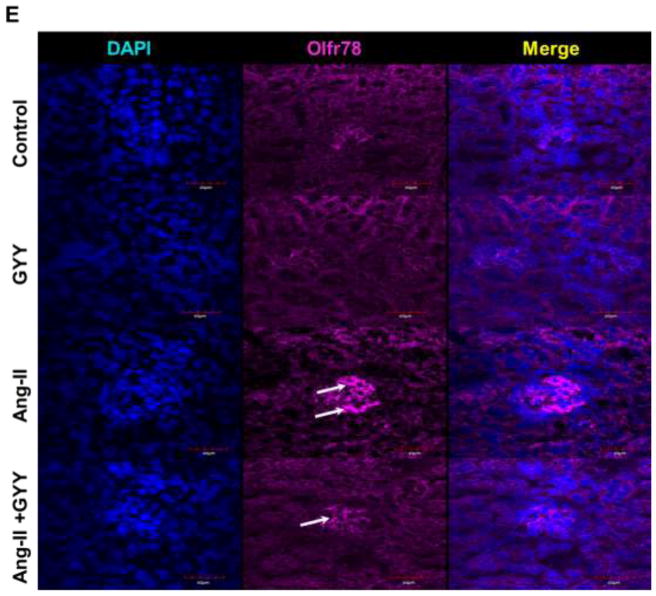
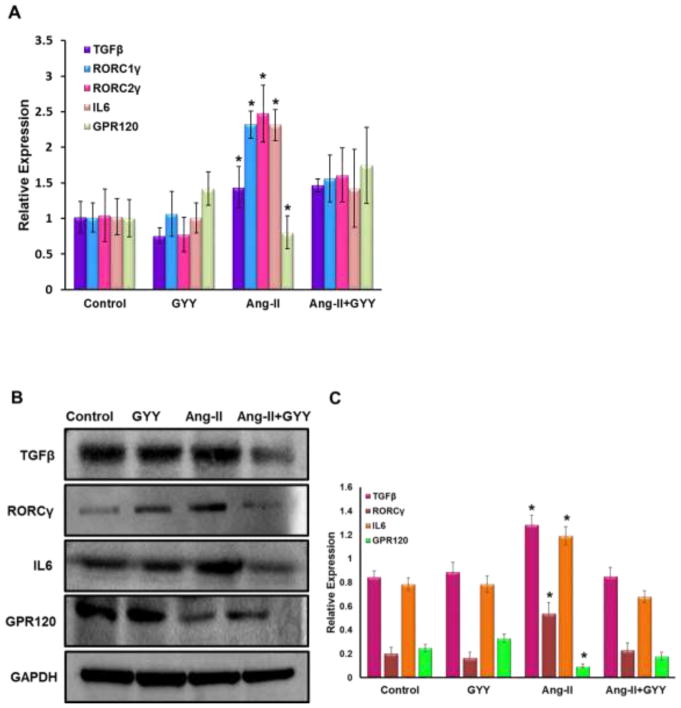
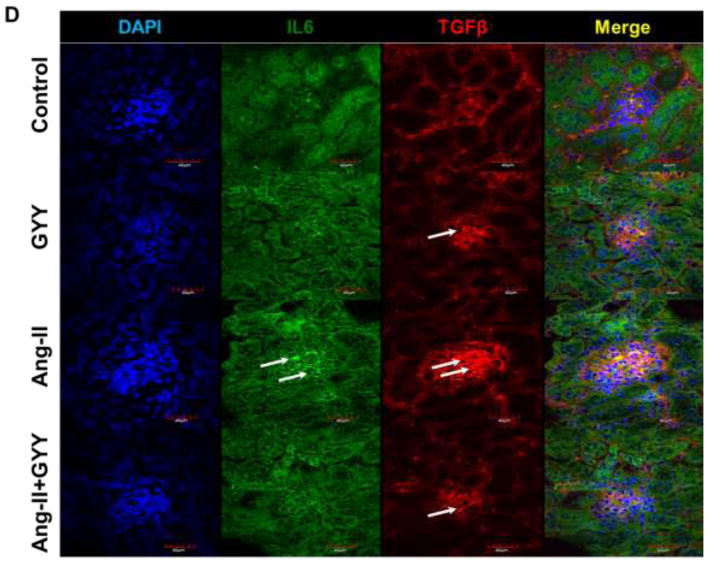
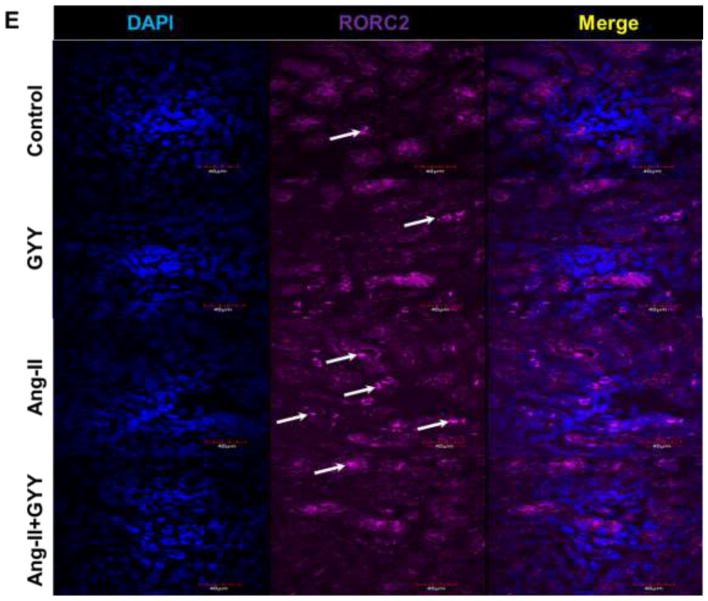
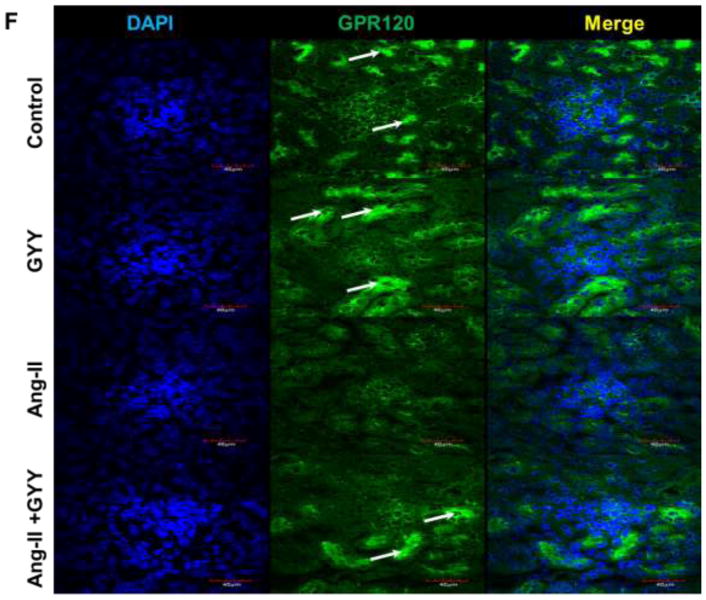
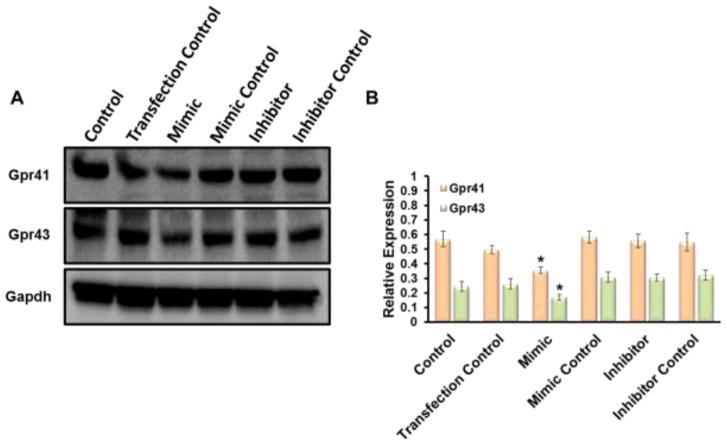
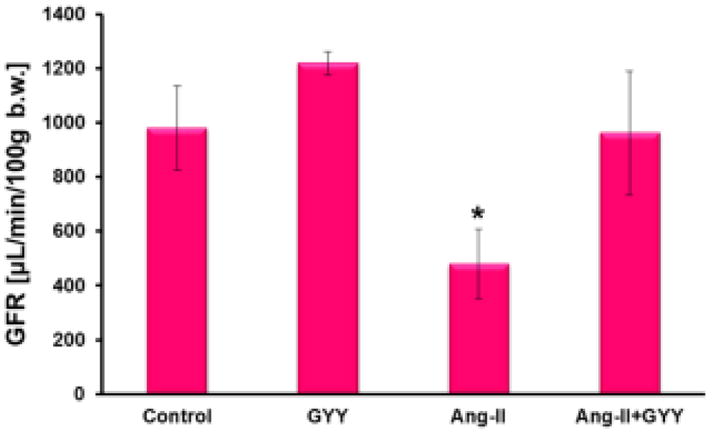
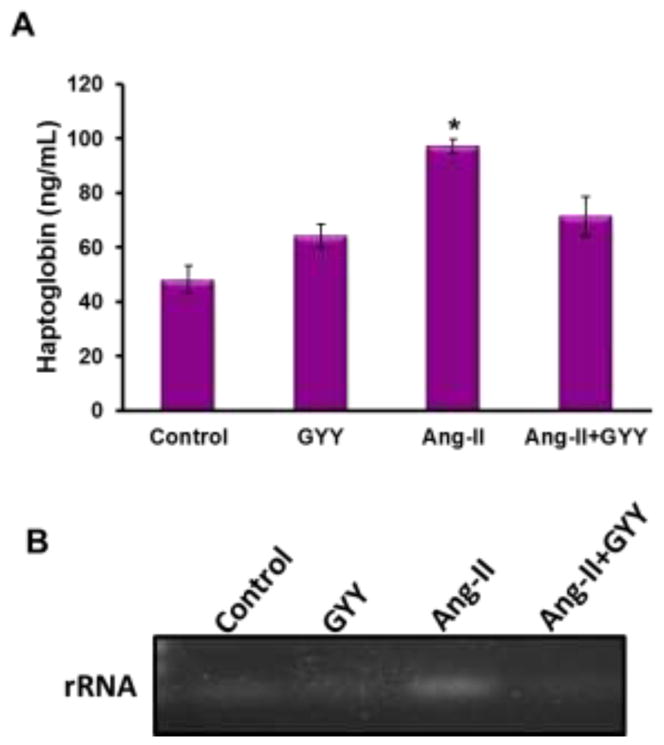
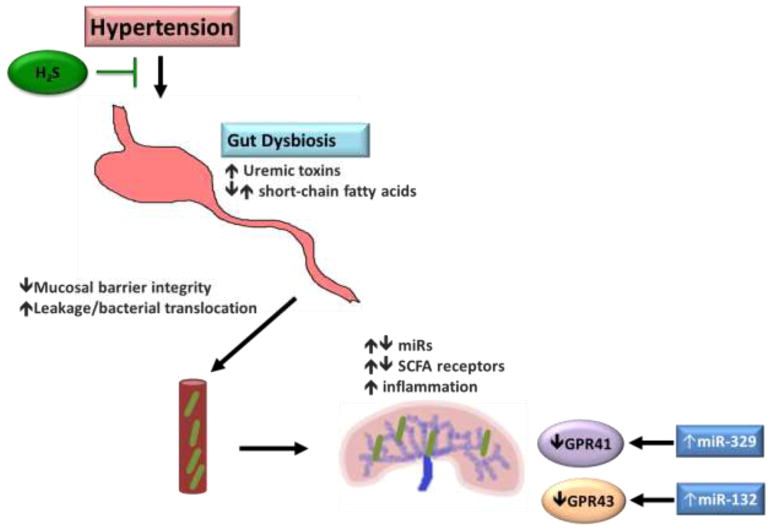
Hypertension affects nearly one third of the adult US population and is a significant risk factor for chronic kidney disease (CKD). An expanding body of recent studies indicates that gut microbiome has crucial roles in regulating physiological processes through, among other mechanisms, one mode of short chain fatty acids (SCFA) and their target receptors. In addition, these SCFA receptors are potential targets of regulation by host miRNAs, however, the mechanisms through which this occurs is not clearly defined. Hydrogen sulfide (H2S) is an important gasotransmitter involved in multiple physiological processes and is known to alleviate adverse effects of hypertension such as reducing inflammation in the kidney. To determine the role of host microRNAs in regulating short chain fatty acid receptors in the kidney as well as the gut, C57BL/6J wild-type mice were treated with or without Ang-II and H2S donor GYY4137 (GYY) for 4 weeks to assess whether GYY would normalize adverse effects observed in hypertensive mice and whether this was in part due to altered gut microbiome composition. We observed several changes of SCFA receptors, including Olfr78, Gpr41/43 and predicted microRNA regulators in the kidney among the different treatments. Increased expression of inflammatory markers Il6 and Rorc2, along with Tgfβ, were found in the hypertensive kidney. The glomerular filtration rate (GFR) was improved in mice treated with Ang-II + GYY compared with Ang-II only, indicating improved kidney function. The Erysipelotrichia class of bacteria, linked with high fat diets, was enriched in hypertensive animals but reduced with GYY supplementation. These data point towards a role for miRNA regulation of SCFA receptors in hypertensive kidney and are normalized by H2S supplementation.
Keywords: Gut microbiome; Hydrogen sulfide; MicroRNA; Short chain fatty acid.
Copyright © 2018 Elsevier Ltd. All rights reserved.
Conflict of interest statement
The authors declare no conflict of interest.
Figures
Similar articles
-
Hydrogen sulfide alleviates hypertensive kidney dysfunction through an epigenetic mechanism.Am J Physiol Heart Circ Physiol. 2017 May 1;312(5):H874-H885. doi: 10.1152/ajpheart.00637.2016. Epub 2017 Feb 17. Am J Physiol Heart Circ Physiol. 2017. PMID: 28213404 Free PMC article.
-
Effects of fast versus slow-releasing hydrogen sulfide donors in hypertension in pregnancy and fetoplacental growth restriction.Naunyn Schmiedebergs Arch Pharmacol. 2019 Dec;392(12):1561-1568. doi: 10.1007/s00210-019-01697-0. Epub 2019 Jul 30. Naunyn Schmiedebergs Arch Pharmacol. 2019. PMID: 31363805
-
Deficiency of Prebiotic Fiber and Insufficient Signaling Through Gut Metabolite-Sensing Receptors Leads to Cardiovascular Disease.Circulation. 2020 Apr 28;141(17):1393-1403. doi: 10.1161/CIRCULATIONAHA.119.043081. Epub 2020 Feb 25. Circulation. 2020. PMID: 32093510
-
The role of short-chain fatty acid on blood pressure regulation.Curr Opin Nephrol Hypertens. 2016 Sep;25(5):379-83. doi: 10.1097/MNH.0000000000000246. Curr Opin Nephrol Hypertens. 2016. PMID: 27490782 Review.
-
Is hydrogen sulfide a potential novel therapy to prevent renal damage during ureteral obstruction?Nitric Oxide. 2018 Feb 28;73:15-21. doi: 10.1016/j.niox.2017.12.004. Epub 2017 Dec 19. Nitric Oxide. 2018. PMID: 29269061 Review.
Cited by
-
Toll-like receptor 4 mutation mitigates gut microbiota-mediated hypertensive kidney injury.Pharmacol Res. 2024 Aug;206:107303. doi: 10.1016/j.phrs.2024.107303. Epub 2024 Jul 11. Pharmacol Res. 2024. PMID: 39002869 Free PMC article.
-
Protective effect of Cistanche deserticola on gentamicin-induced nephrotoxicity in rats.Chin Herb Med. 2022 Dec 16;15(1):102-109. doi: 10.1016/j.chmed.2022.03.008. eCollection 2023 Jan. Chin Herb Med. 2022. PMID: 36875447 Free PMC article.
-
Short-Chain Fatty Acid Receptors and Blood Pressure Regulation: Council on Hypertension Mid-Career Award for Research Excellence 2021.Hypertension. 2022 Oct;79(10):2127-2137. doi: 10.1161/HYPERTENSIONAHA.122.18558. Epub 2022 Aug 1. Hypertension. 2022. PMID: 35912645 Free PMC article. Review.
-
ACT001 Alleviates chronic kidney injury induced by a high-fat diet in mice through the GPR43/AMPK pathway.Lipids Health Dis. 2023 Nov 18;22(1):198. doi: 10.1186/s12944-023-01949-2. Lipids Health Dis. 2023. PMID: 37978497 Free PMC article.
-
Alterations of the Gut Microbiota in Patients With Severe Chronic Heart Failure.Front Microbiol. 2022 Jan 31;12:813289. doi: 10.3389/fmicb.2021.813289. eCollection 2021. Front Microbiol. 2022. PMID: 35173696 Free PMC article.
References
-
- Appel LJ, Brands MW, Daniels SR, Karanja N, Elmer PJ, Sacks FM American Heart A. Dietary approaches to prevent and treat hypertension: a scientific statement from the American Heart Association. Hypertension. 2006;47:296–308. - PubMed
-
- Aron-Wisnewsky J, Clement K. The gut microbiome, diet, and links to cardiometabolic and chronic disorders. Nat Rev Nephrol. 2016;12:169–181. - PubMed
-
- Barlow CE, LaMonte MJ, Fitzgerald SJ, Kampert JB, Perrin JL, Blair SN. Cardiorespiratory fitness is an independent predictor of hypertension incidence among initially normotensive healthy women. Am J Epidemiol. 2006;163:142–150. - PubMed
-
- Benjamin EJ, Virani SS, Callaway CW, Chamberlain AM, Chang AR, Cheng S, Chiuve SE, Cushman M, Delling FN, Deo R, de Ferranti SD, Ferguson JF, Fornage M, Gillespie C, Isasi CR, Jimenez MC, Jordan LC, Judd SE, Lackland D, Lichtman JH, Lisabeth L, Liu S, Longenecker CT, Lutsey PL, Mackey JS, Matchar DB, Matsushita K, Mussolino ME, Nasir K, O’Flaherty M, Palaniappan LP, Pandey A, Pandey DK, Reeves MJ, Ritchey MD, Rodriguez CJ, Roth GA, Rosamond WD, Sampson UKA, Satou GM, Shah SH, Spartano NL, Tirschwell DL, Tsao CW, Voeks JH, Willey JZ, Wilkins JT, Wu JH, Alger HM, Wong SS, Muntner P American Heart Association Council on E, Prevention Statistics C and Stroke Statistics S. Heart Disease and Stroke Statistics-2018 Update: A Report From the American Heart Association. Circulation. 2018;137:e67–e492. - PubMed
-
- Border WA, Noble NA. Interactions of transforming growth factor-beta and angiotensin II in renal fibrosis. Hypertension. 1998;31:181–188. - PubMed
Publication types
MeSH terms
Substances
Grants and funding
LinkOut - more resources
Full Text Sources
Other Literature Sources
Medical
Miscellaneous
