. 2018 Jun 27;6(6):709-721.e6.
doi: 10.1016/j.cels.2018.05.009. Epub 2018 Jun 13.

Genetic Regulation of Plasma Lipid Species and Their Association with Metabolic Phenotypes

Affiliations

Genetic Regulation of Plasma Lipid Species and Their Association with Metabolic Phenotypes

Pooja Jha et al. Cell Syst. .

Abstract

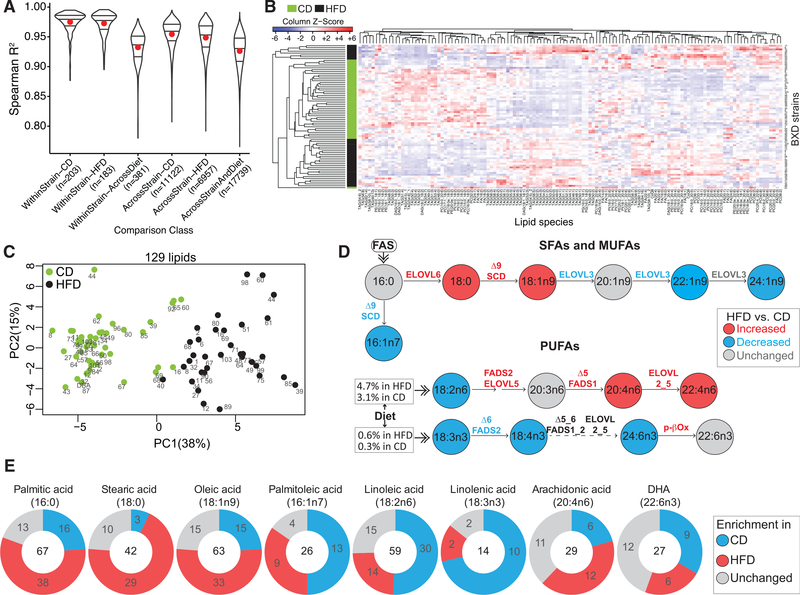
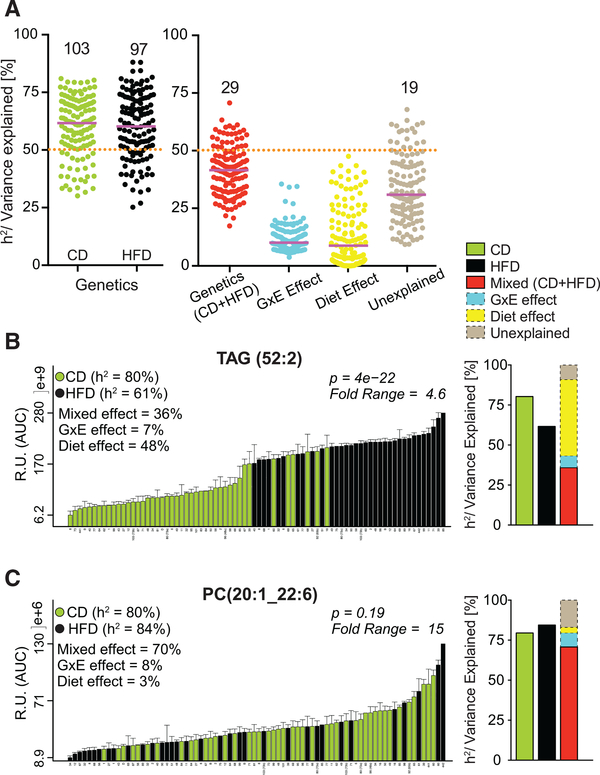
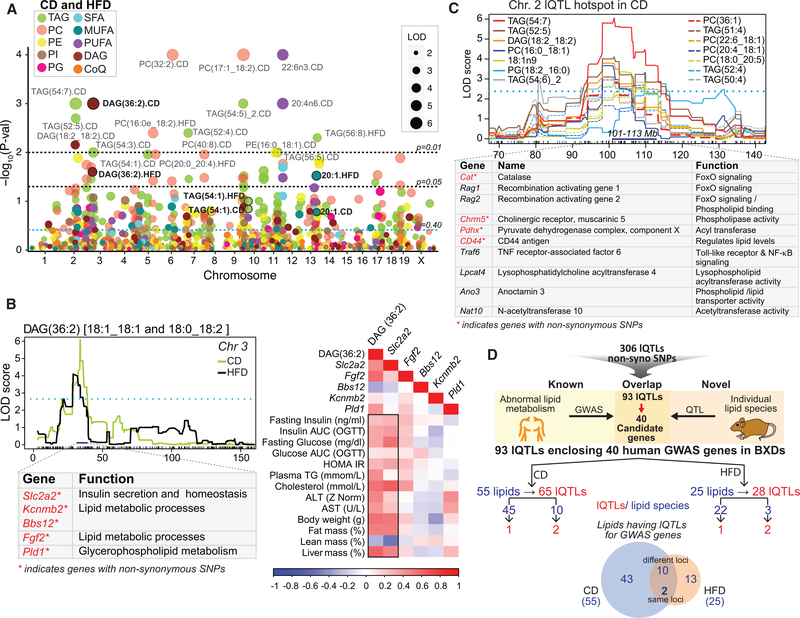
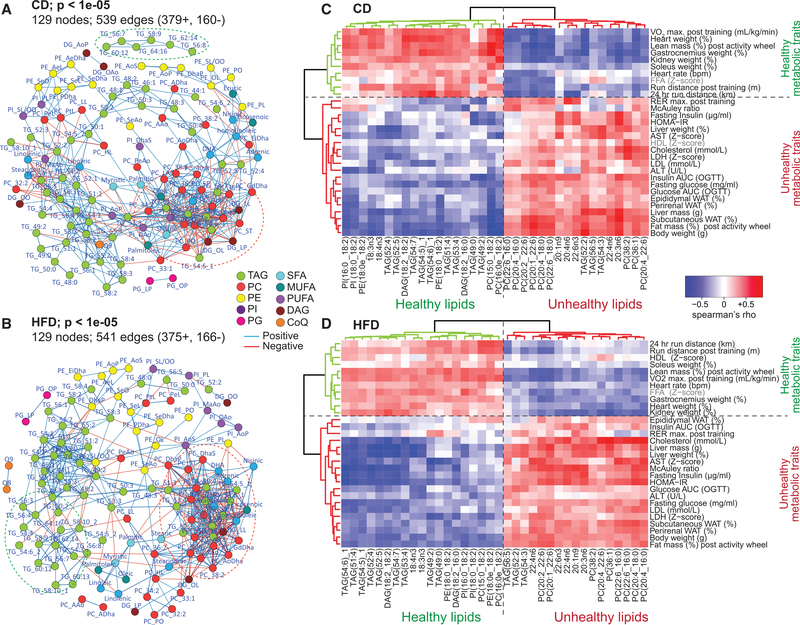
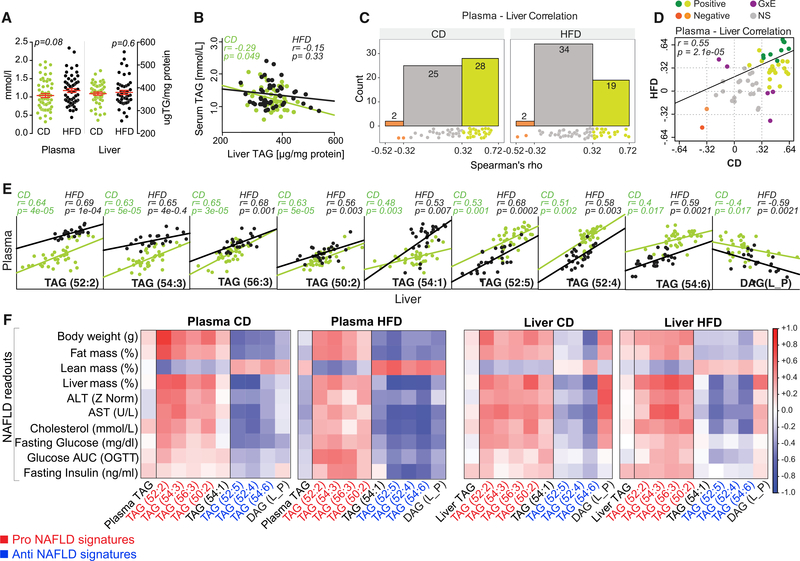
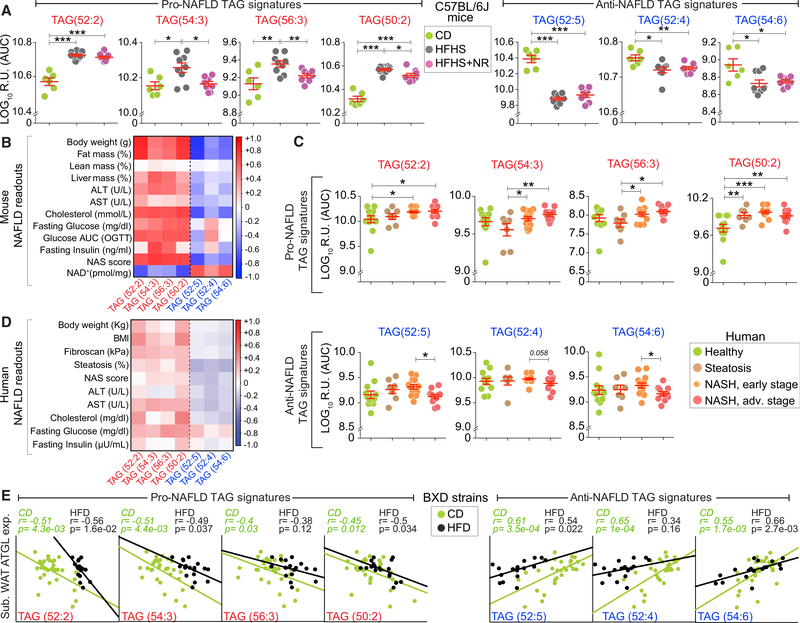
The genetic regulation and physiological impact of most lipid species are unexplored. Here, we profiled 129 plasma lipid species across 49 strains of the BXD mouse genetic reference population fed either chow or a high-fat diet. By integrating these data with genomics and phenomics datasets, we elucidated genes by environment (diet) interactions that regulate systemic metabolism. We found quantitative trait loci (QTLs) for ∼94% of the lipids measured. Several QTLs harbored genes associated with blood lipid levels and abnormal lipid metabolism in human genome-wide association studies. Lipid species from different classes provided signatures of metabolic health, including seven plasma triglyceride species that associated with either healthy or fatty liver. This observation was further validated in an independent mouse model of non-alcoholic fatty liver disease (NAFLD) and in plasma from NAFLD patients. This work provides a resource to identify plausible genes regulating the measured lipid species and their association with metabolic traits.

Keywords: BXD; TAG,; fatty liver,; genetic reference population, GRP,; genetic variation; lipid species; lipidomics; non-alcoholic fatty liver disease, NAFLD,; quantitative trait locus, QTL,; steatosis,.


Conflict of interest statement

DECLARATION OF INTERESTS

The authors declare no competing interests.

Figures

Figure 1.
Figure 1.. Dietary Impact on the Plasma Lipids Measured
(A) Pairwise correlation to assess the sensitivity of MS to detect global diet- and strain-driven differences across 280 samples. Red dot represents mean; the three lines represent median, upper, and lower quartile. (B) Heatmap of unsupervised hierarchical clustering of 129 lipid species for each BXD cohort. (C) PCA of all lipids in each BXD strain (indicated by the strain number). (D) Schematic representation of the systemic profile of saturated fatty acids (SFAs) and monounsaturated fatty acids (MUFAs) (top) and polyunsaturated fatty acids (PUFAs) (bottom) in BXDs, based on the levels of the free fatty acids (FFAs) measured. Significant changes (HFD versus CD; p < 0.05) for FFA levels, activity of the desaturases and elongases (ratio of product and precursor FFA) are shown as red for increase or blue for decrease. (E) Pie chart showing the dietary enrichment of eight common side chain FAs in the lipid species in either diet. Number in the center indicates the total number of lipids having at least one indicated FA side chain. For each pie chart, the three colors represent the number of lipids (having the indicated FA side chain) increased in HFD versus CD (red), CD versus HFD (blue), or unchanged (gray). See also Figure S1, Tables S1 and S2.
Figure 2.
Figure 2.. Plasma Lipid Species Have High Heritability
(A) Heritability/variance explained of all lipid species. Number of lipids (out of 129) that have ≥50% of their variance explained by the factors along the x axis is indicated. Purple line represents median variance explained. (B and C) Example of two lipid species having high h2 in both diets but highly affected by diet (TAG(52:2)) (B), or unaffected by diet (PC(20:1_22:6)) (C). Bar plot showing the variation of the two lipids in the BXD population is shown on the left and the percentage of h2/variance explained by the different factors is indicated in the graph as well as graphically represented on the right. Data are represented as means ± SEM. See also Table S3.
Figure 3.
Figure 3.. Plasma Lipids Are Influenced by Many Genomic Loci, Including Several Associated with Lipid Levels in Human GWAS
(A) Manhattan plot of lipid species. Lipids indicated in black bold font (DAG(36:3), TAG(54:1), and 20:1) have the same QTL position in CD and HFD. lQTLs with p value < 0.01 are indicated on the plot. The black and blue dotted lines represent significant and suggestive QTL threshold, respectively. (B) lQTLs for one of the three lipids (DAG(36:2)) having a QTL at the same locus in both diets (top-left). Select lQTL genes and their function are indicated below (bottom-left). Pearson correlation of DAG(36:2) alongside the expression of its liver lQTL genes (in CD) with metabolic syndrome phenotypes (right). (C) Hotspot region comprising 14 lQTLs on chromosome 2. Genes associated with lipid metabolism in this region are indicated below. (D) Genes with protein coding variants under 306 lQTLs were screened for any known association with blood lipids and associated metabolic traits in human GWAS. The screening identified 40 GWAS genes (with nsSNPs) from 93 lQTLs. 55/25 lipids contributed to 65/28 QTLs harboring GWAS genes in CD/HFD with 12 lipids in common across diet. 45/22 lipids mapped to one GWAS gene each in CD/HFD, whereas 10/3 lipids mapped to two different GWAS genes each. See also Tables S4 and S5.
Figure 4.
Figure 4.. Association of Lipid Species with Metabolic Traits
(A and B) Spearman correlation network of all lipid species in CD (A) and HFD (B). Lipid species are color coded as 10 major lipid classes. (C and D) Heatmap with an unsupervised hierarchical clustering of Spearman’s correlation rho value of 36 lipids with metabolic phenotypes. These 36 lipids show the same correlation trend with metabolic phenotypes in both CD (C) and HFD (D). The horizontal green phenotype cluster represents healthy metabolic traits, whereas the red cluster represents unhealthy metabolic traits. The vertical green lipid cluster represents the healthy markers of metabolic health/fitness, whereas the red cluster represents the unhealthy markers of metabolic health/fitness. Table S6 provides the rho and p values for each lipid-phenotype correlation. See also Figure S3 and Table S6.
Figure 5.
Figure 5.. Identification of Lipid Species as Markers of NAFLD
(A and B) Plasma and liver TAG concentration (A) and correlation (B) in BXD cohorts. Data are represented as means ± SEM. (C and D) 55 common lipid species between plasma and liver were correlated using Spearman’s method. (C) Histogram of the rho correlation value of these 55 lipid pairs in CD (left) and HFD (right). (D) Correlation of rho values between CD and HFD from (C) to identify lipids, which behave similarly despite the dietary switch. Green dots indicate lipid species with positive correlation (wherein dark green dots are significant; p < 0.05), red and orange dots indicate lipids with negative correlation (wherein red dot is significant; p < 0.05). Purple dots indicate lipid species with opposite correlation in CD and HFD, reflective of GxE effect. (E) Pearson correlation of nine significant lipid species identified in (D) (dark green and red dots) in liver and plasma. (F) Correlation matrix showing the Pearson correlation of the nine lipids, alongside plasma and liver TAG with NAFLD readouts. See also Figure S4 and Table S7.
Figure 6.
Figure 6.. Validation of NAFLD TAG Signatures in Mice and Humans
(A) Levels of pro- and anti-NAFLD signatures in livers of C57BL/6J mice fed on CD, high-fat high-sucrose-diet (HFHS) and HFHS diet supplemented with NR,9 weeks after the initiation of HFHS diet (HFHS + NR). Data are represented as means ± SEM. (B) Pearson correlation matrix of the pro- and anti-NAFLD signatures with NAFLD readouts including the NAS score (NAFLD activity score) and liver NAD+ levels. (C) Levels of plasma NAFLD signatures in human subjects with various degrees of NAFLD. Data are represented as means ± SEM. (D) Pearson correlation matrix of the NAFLD signatures with NAFLD readouts in human subjects. (E) Pearson correlation of Atgl expression in subcutaneous WAT with pro- and anti-NAFLD plasma TAG signatures in BXD strains. For mice: n = 6–9 per group. For human subjects: n = 12, healthy; n = 7, steatosis; n = 14, early-stage NASH; n = 11, advanced-stage NASH. Differences in mean TAG species were compared using two-sample t tests. *p < 0.05, **p < 0.01, ***p < 0.001. See also Figure S5.

Similar articles

Cited by

References

    1. Belknap JK (1998). Effect of within-strain sample size on QTL detection and mapping using recombinant inbred mouse strains. Behav. Genet 28, 29–38. - PubMed
    1. Broman KW, Wu H, Sen S, and Churchill GA (2003). R/qtl: QTL mapping in experimental crosses. Bioinformatics 19, 889–890. - PubMed
    1. Browning JD, Szczepaniak LS, Dobbins R, Nuremberg P, Horton JD, Cohen JC, Grundy SM, and Hobbs HH (2004). Prevalence of hepatic steatosis in an urban population in the United States: impact of ethnicity. Hepatology 40, 1387–1395. - PubMed
    1. Dewey FE, Murray MF, Overton JD, Habegger L, Leader JB, Fetterolf SN, O’Dushlaine C, Van Hout CV, Staples J, Gonzaga-Jauregui C, et al. (2016). Distribution and clinical impact of functional variants in 50,726 whole-exome sequences from the DiscovEHR study. Science 354, 10.1126/science.aaf6814. - DOI - PubMed
    1. Diabetes Genetics Initiative of Broad Institute of Harvard and MIT Lund University and Novartis Institutes of BioMedical Research, Saxena R, Voight BF, Lyssenko V, Burtt NP, de Bakker PI, Chen H, Roix JJ, Kathiresan S, Hirschhorn JN, et al. (2007). Genome-wide association analysis identifies loci for type 2 diabetes and triglyceride levels. Science 316, 1331–1336. - PubMed

Publication types

MeSH terms