. 2019 Feb;65(1):179-192.
doi: 10.1007/s00294-018-0858-0. Epub 2018 Jun 16.

Genetic control of ColE1 plasmid stability that is independent of plasmid copy number regulation

Affiliations

Genetic control of ColE1 plasmid stability that is independent of plasmid copy number regulation

Melissa S Standley et al. Curr Genet. 2019 Feb.

Abstract

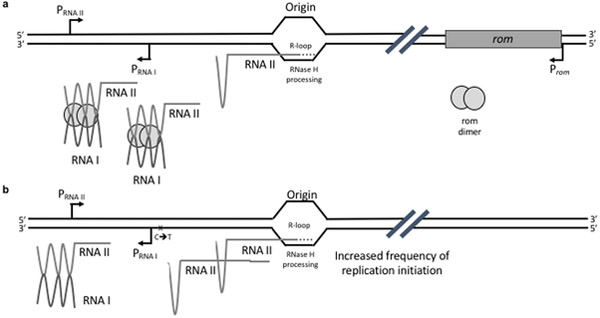
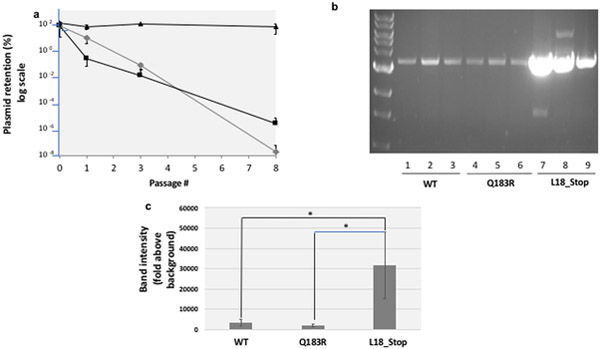
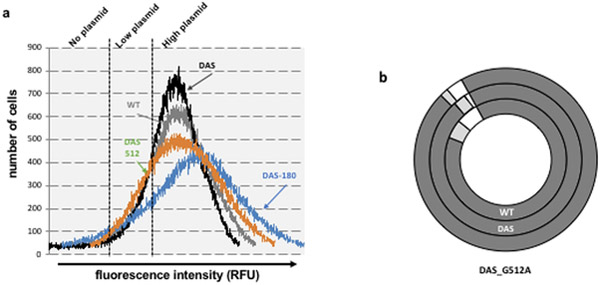
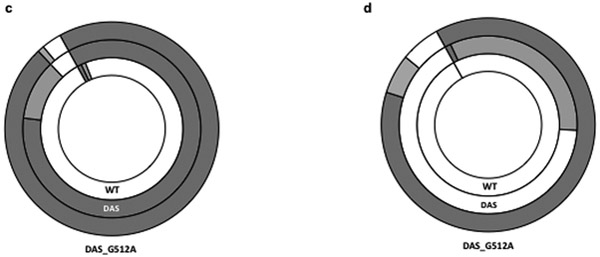
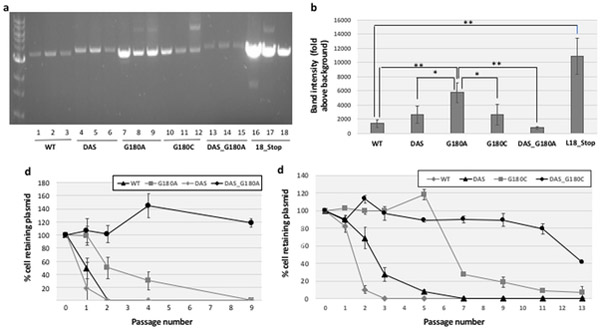
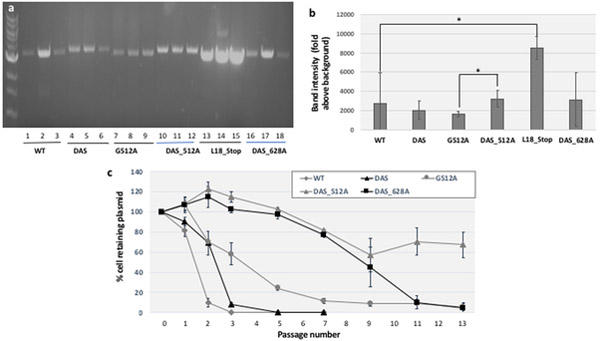
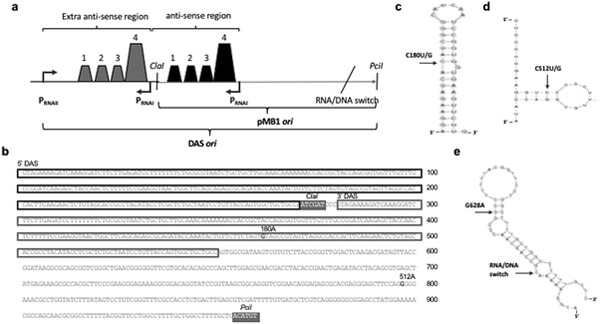
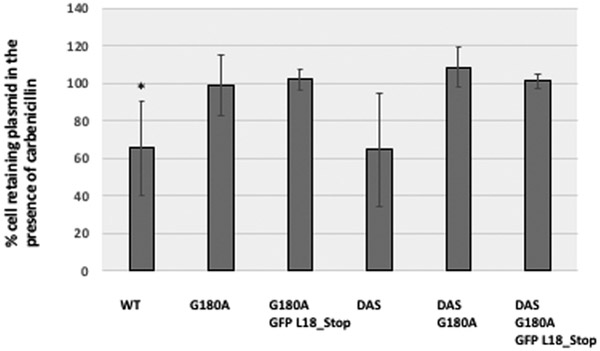
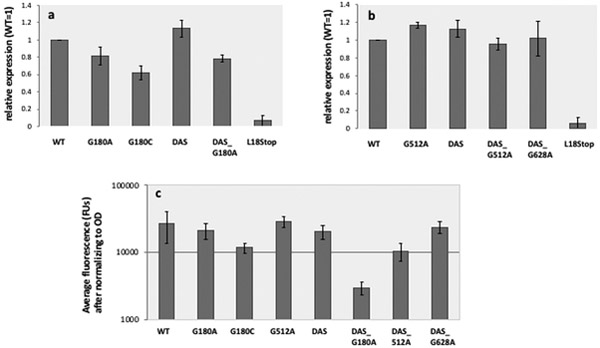
ColE1-like plasmid vectors are widely used for expression of recombinant genes in E. coli. For these vectors, segregation of individual plasmids into daughter cells during cell division appears to be random, making them susceptible to loss over time when no mechanisms ensuring their maintenance are present. Here we use the plasmid pGFPuv in a recA relA strain as a sensitized model to study factors affecting plasmid stability in the context of recombinant gene expression. We find that in this model, plasmid stability can be restored by two types of genetic modifications to the plasmid origin of replication (ori) sequence: point mutations and a novel 269 nt duplication at the 5' end of the plasmid ori, which we named DAS (duplicated anti-sense) ori. Combinations of these modifications produce a range of copy numbers and of levels of recombinant expression. In direct contradiction with the classic random distribution model, we find no correlation between increased plasmid copy number and increased plasmid stability. Increased stability cannot be explained by reduced levels of recombinant gene expression either. Our observations would be more compatible with a hybrid clustered and free-distribution model, which has been recently proposed based on detection of individual plasmids in vivo using super-resolution fluorescence microscopy. This work suggests a role for the plasmid ori in the control of segregation of ColE1 plasmids that is distinct from replication initiation, opening the door for the genetic regulation of plasmid stability as a strategy aimed at enhancing large-scale recombinant gene expression or bioremediation.

Keywords: Antisense RNA; Bioremediation; Biotechnology; ColE1 plasmid; High copy number plasmid; Origin of replication; Plasmid segregation; Plasmid stability; Recombinant expression.


Figures

Fig. 1
Fig. 1. ColE1-like plasmid copy number regulation by antisense RNA.
a. Original pMB1 plasmid. b. pUC19 origin of replication present in pGFPuv. ColE1 plasmid replication is regulated by sequence elements known as the plasmid origin of replication (ori). Replication starts with the transcription of an RNA pre-primer. This RNA pre-primer (RNAII) forms a stable hybrid at its 3’ end with ori DNA (R-loop). Processing of this R-loop RNA by RNaseH generates a free 3’–OH end that is extended by DNA polymerase I (Pol I), initiating leading-strand synthesis (Itoh and Tomizawa, 1980). Replication initiation is negatively regulated by an antisense RNA mechanism that maintains copy number constant for a given physiological condition (Brantl, 2014; Camps, 2010). The 108 bp antisense RNA (RNAI) is transcribed from a strong promoter located downstream and in the opposite orientation from the promoter for RNAII. RNAI is short-lived and forms a stable hybrid with the pre-primer RNA, blocking downstream R-loop formation by irreversibly altering the folding of the pre-primer (Cesareni et al., 1991; Polisky, 1988). In the original pMB1 origin of replication, the hybridization between RNAI and RNAII is facilitated and stabilized by a small dimeric protein, Rom (for RNA one modulator) (Lacatena et al., 1984; Tomizawa and Som, 1984). pUC19 is a pMB1-derivative lacking rom and harboring a C→T mutation in the ori, immediately downstream of the RNAI promoter, leading to a G→A substitution in the RNAII. This mutation appears to alter the secondary structure of pUC19’s RNAII, promoting normal folding of the pre-primer. As a result, pUC19 exhibits a several-fold increase in plasmid copy number relative to its parental pMB1 (Lin-Chao et al., 1992).
Fig. 2.
Fig. 2.. The pGFPuv retention model of plasmid stability.
a. Plasmid stability. Cells transformed with plasmids harboring wild-type pGFPuv (grey diamonds), a Q183R mutant of GFP (which abolishes fluorescence, black squares), and a L18* truncated mutant (black triangles) were washed from plates with carbenicillin, normalized for cell number and expanded in liquid culture in the presence of carbenicillin. After the first passage (passage 0), these cells were passaged 8 more times through a 1:105 dilution and growth for 22h in LB at 37˚C in the absence of carbenicillin. To monitor plasmid retention, at specific time-points cells were withdrawn, serially diluted and plated in the presence or absence of carbenicillin. CFUs arising after 16 hours incubation at 37˚C were quantified. b Plasmid copy number. Plasmids from a normalized number of cells bearing the WT pGFPuv plasmid, the Q183R (non-fluorescent) mutant and the L18_Stop (truncated) mutant were recovered, linearized, and run on an agarose gel as described in the Methods. c Gel band density quantification. Band intensities in the gel shown in section b were measured by densitometry using Image J software, with fixed area size for all the samples, and averaged. Error bars represent the standard deviation for three replicates. The difference between L18_Stop and WT and between L18_Stop and Q183R was confirmed by a 2-tailed unpaired Student t test (p<0.05) (asterisks).
Fig. 3
Fig. 3. Plasmid copy number distribution and plasmid retention by flow cytometry.
a. Fluorescence emission distribution in the presence of antibiotic, as an approximate indication of plasmid copy number distribution in the population. Cells transformed with WT pGFPuv (WT, grey line), DAS-pGFPuv (DAS, black line), pGFPuv DAS-G180A (DAS180A, blue line), or pGFPuv DAS-G512A (DAS512, red line), were grown in the presence carbenicillin and analyzed by flow cytometry. Fluorescence emission and scatter for 250,000 single cells was analyzed by flow cytometry as described in Methods. All distributions were centered in the geometric mean to allow comparison. Three subpopulations were defined based on the fluorescence emission profile as described in Methods. The results show one representative experiment. b. Plasmid retention. Cells carrying the WT pGFPuv plasmid (WT), the pGFPuv-DAS plasmid (DAS) or the pGFPuv-DAS plasmid with the G512A substitution (DAS_G512A) were grown in the presence of carbenicillin, analyzed by flow cytometry, and placed into one of the three categories following the parameters defined for the control: no plasmid (white), low plasmid (light grey), or high plasmid (dark grey). c. Same analysis performed after a single passage in the absence of carbenicillin as described in the legend for Fig. 2 and in Methods. d. Same analysis performed after four passages in the absence of carbenicillin as described in the legend for Fig. 2 and in Methods.
Fig. 4.
Fig. 4.. Effects of G180 ori point mutations (with and without DAS)
a. Effects on plasmid copy number. The copy number of pGFPuv plasmids containing G180 ori point mutations, both in the presence and absence of DAS, was determined by miniprep extraction, restriction enzyme linearization and agarose gel electrophoresis as described in Methods. b. Quantitative Measurement. Band intensities in the gel shown in section a were measured by densitometry using Image J software, with fixed area size for all the samples, and averaged. Error bars represent the standard deviation for three replicates. Statistically significant differences were confirmed by a 2-tailed, unpaired Student t test, with one asterisk indicative of p<0.05 and two asterisks indicative of p<0.01. c. Plasmid stability of G180A-containing variants and d. Plasmid stability of G180C-containing variants. The stability of the pGFPuv plasmids included in sections a and b was determined by serial passage in liquid culture in the absence of carbenicillin, and determining the % cells retaining carbenicillin resistance as described in Methods. Error bars represent the standard deviation of three biological replicates. The legend is shown on the upper right corner of the figure.
Fig. 5.
Fig. 5.. Effects of G512 ori point mutations with and without DAS on plasmid copy number and on plasmid stability.
a. Effects on plasmid copy number. The plasmid copy number of pGFPuv containing point-mutations at the 512 position, both in the presence and absence of DAS, and of DAS_G628A ori was determined by miniprep extraction, restriction enzyme linearization and agarose gel electrophoresis as described in Methods. b. Quantitative measurement. Band intensities in the gel shown in section a were measured by densitometry using Image J software, with fixed area size for all the samples, and averaged. Error bars represent the standard deviation for three biological replicates. Statistically significant differences were confirmed by a 2-tailed, unpaired Student t test, with one asterisk indicative of p<0.05. c. Plasmid stability. The stability of the pGFPuv plasmids included in sections a and b was determined by serial passage in liquid culture in the absence of carbenicillin, and determining the % cells retaining carbenicillin resistance as described in Methods. Error bars represent the standard deviation of three biological replicates. The legend is shown on the upper right corner of the figure.
Fig. 6
Fig. 6. Map of modifications increasing pMB1 stability.
a Duplicated antisense sequence Schematic showing the duplication of antisense sequence (DAS). Shown are promoters PRNAI and PRNAII; the stem-loop structures that are important for antisense regulation; the two restriction sites used for cloning of the plasmid ori mutants; and the position of the RNA/DNA switch. b. DAS ori sequence. Duplicated sequences are boxed; mutations tested for increased stability are highlighted in bold, denoting nucleotide positions (relative to the start of the ori following standard ColE1 numbering (Ohmori and Tomizawa, 1979)) and base pair substitutions. The two restriction sites used for cloning of the plasmid ori mutants are denoted and highlighted in grey boxes. c Location of the G180A/C mutation. This mutation is mapped on a secondary structure for stem-loop number four of RNAII, which comprises nucleotides 172 through 207. The secondary structure shown is the most stable one predicted using the mfold program (Zuker, 2003), with a ΔG=−12.20 kcal/mol. d Location of the G512A/C mutation. This mutation is mapped on a secondary structure for hairpin 2 of RNAII, which comprises nucleotides 508 through 525. The model shown is the most stable one predicted using the mfold program (Zuker, 2003), with a ΔG=−7.3 kcal/mol. e Location of the G628A mutation. This mutation is mapped on a secondary structure for single-stranded DNA in area surrounding the RNA/DNA switch. The model shown is the most stable one predicted using the mfold program (Zuker, 2003), with a ΔG=−11.27 kcal/mol.
Fig. 7
Fig. 7. Effects of stabilizing mutations on viability in carbenicillin.
Here we compare WT and DAS oris (which are unstable and moderately stable, respectively) with plasmid ori variants of these two oris containing G180A and G180A with GFP_L18Stop (both of which are highly stable). For each sample, six cultures were grown on carbenicillin and plated on carbenicillin or LB plates (for DAS we only had 5 samples, and for G180A and for DAS_G180A GFP_L18_stop only 3). The ratio of colonies grown in the presence of carbenicillin vs. LB was averaged out. To account for differences in n between samples, the error bars represent standard error of the mean, not standard deviation. Significant decreases in ratio were established through a one-tailed, paired Student’s t-test. For WT, the p-value was <0.012 (asterisk), and for DAS, p<0.074.
Fig. 8
Fig. 8. Quantification of GFP expression.
a. Western blot values. GFP expression for cells expressing the engineered variants listed in the X axis is shown, as band intensity on a Western blot, determined by densitometry, normalized to that of WT. Error bars represent standard deviation of two biological replicas. b. Fluorescence values. The fluorescence of cultures expressing the engineered variants listed on the X axis was measured as described in Methods and plotted (in log scale) on the Y-axis. Error bars represent standard deviation of 10 biological replicas.

Similar articles

Cited by

References

    1. Bergstrom CT, Lipsitch M, and Levin BR (2000). Natural selection, infectious transfer and the existence conditions for bacterial plasmids. Genetics 155, 1505–1519. - PMC - PubMed
    1. Brantl S (2014). Plasmid Replication Control by Antisense RNAs. Microbiology spectrum 2, PLAS-0001–2013. - PubMed
    1. Camps M (2010). Modulation of ColE1-like plasmid replication for recombinant gene expression. Recent patents on DNA & gene sequences 4, 58–73. - PMC - PubMed
    1. Cesareni G, Helmer-Citterich M, and Castagnoli L (1991). Control of ColE1 plasmid replication by antisense RNA. Trends Genet 7, 230–235. - PubMed
    1. Cooper NS, Brown ME, and Caulcott CA (1987). A mathematical method for analysing plasmid stability in micro-organisms. J Gen Microbiol 133, 1871–1880. - PubMed