. 2018;14(8):1293-1309.
doi: 10.1080/15548627.2018.1474991. Epub 2018 Jul 21.

Mitochondrial protein import regulates cytosolic protein homeostasis and neuronal integrity

Affiliations

Mitochondrial protein import regulates cytosolic protein homeostasis and neuronal integrity

Wei Liu et al. Autophagy. 2018.

Abstract

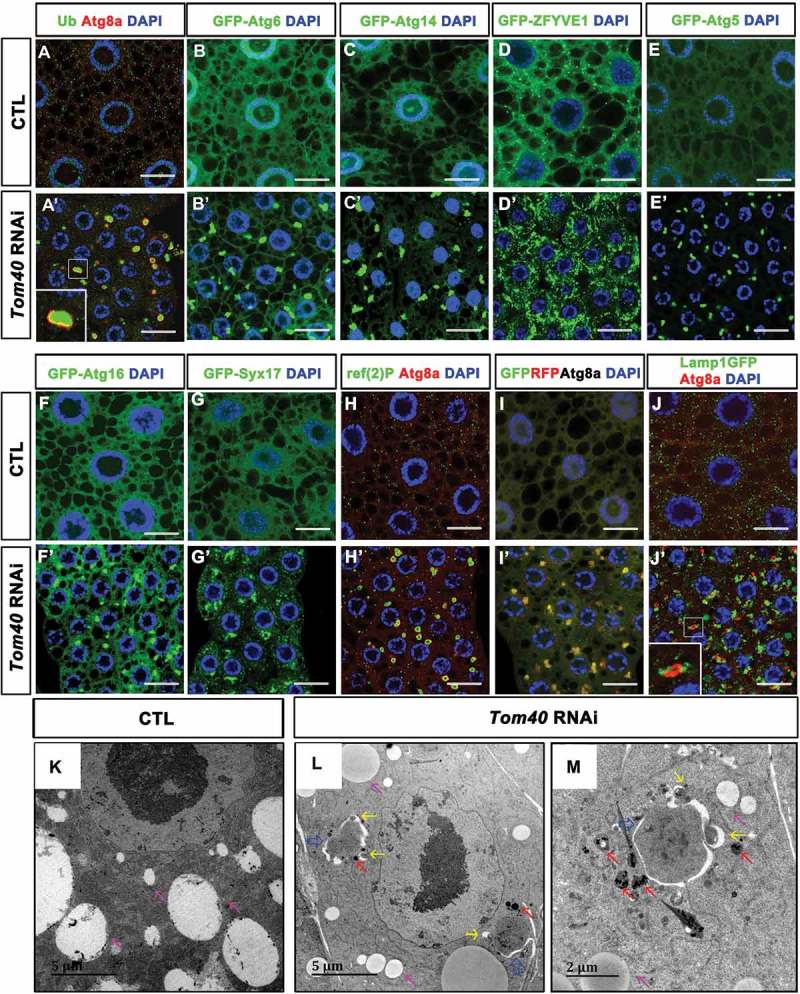
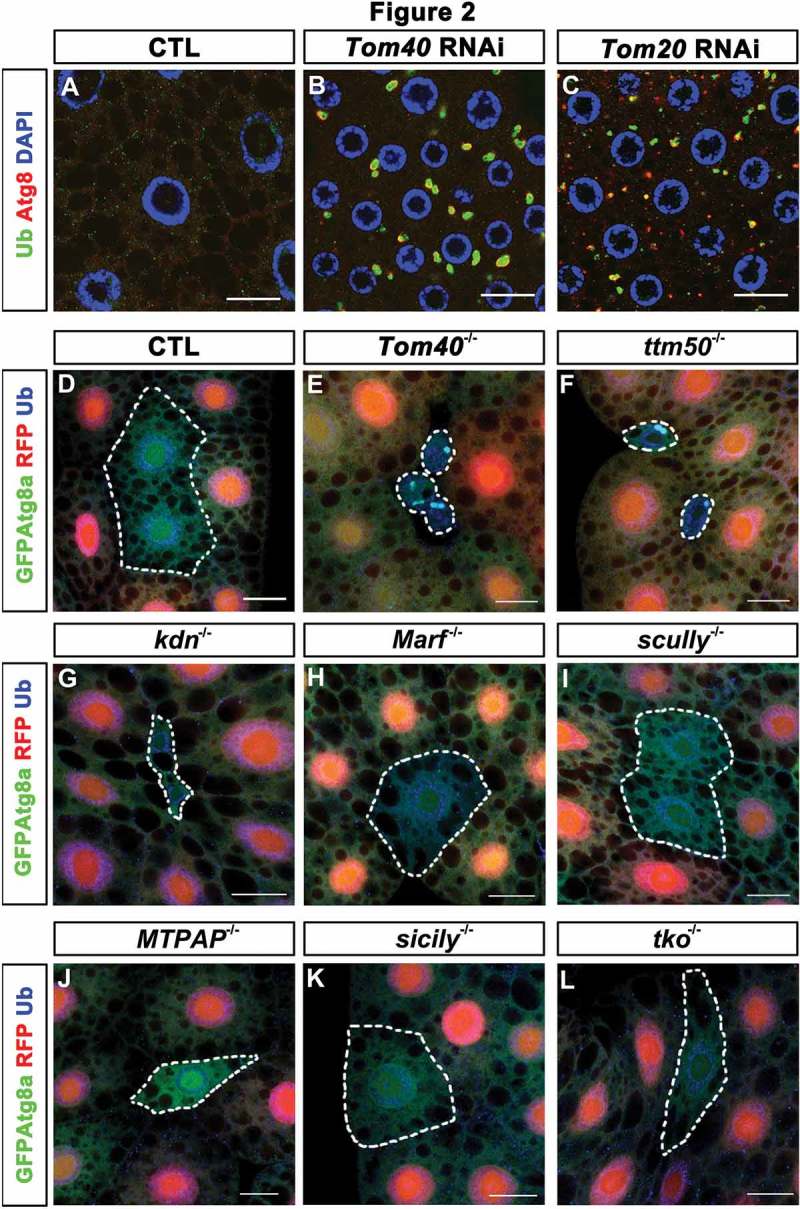
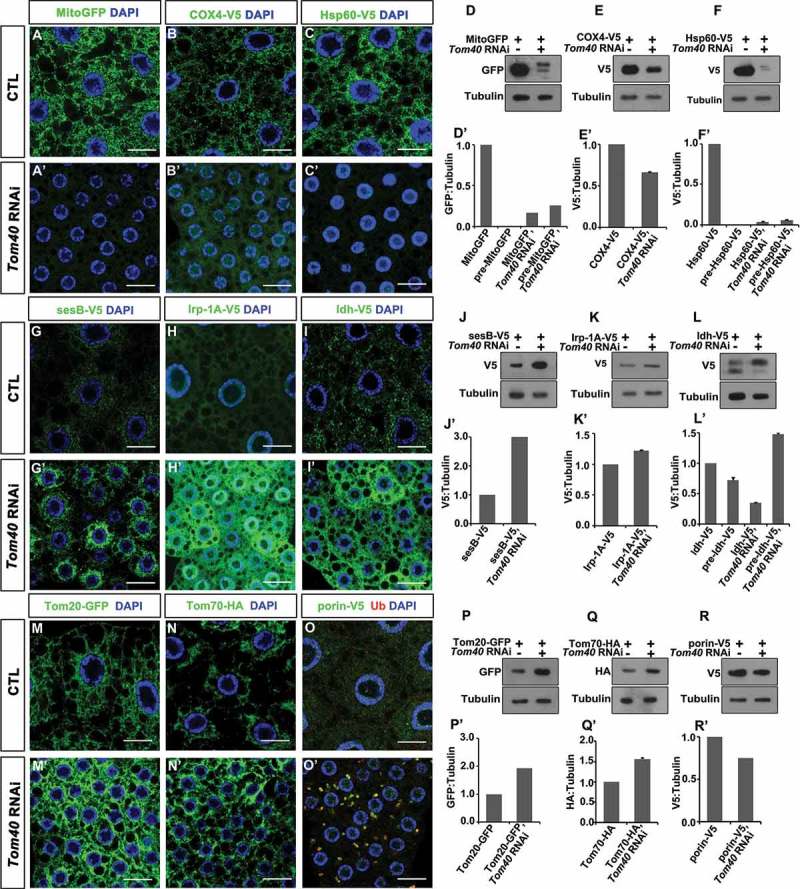
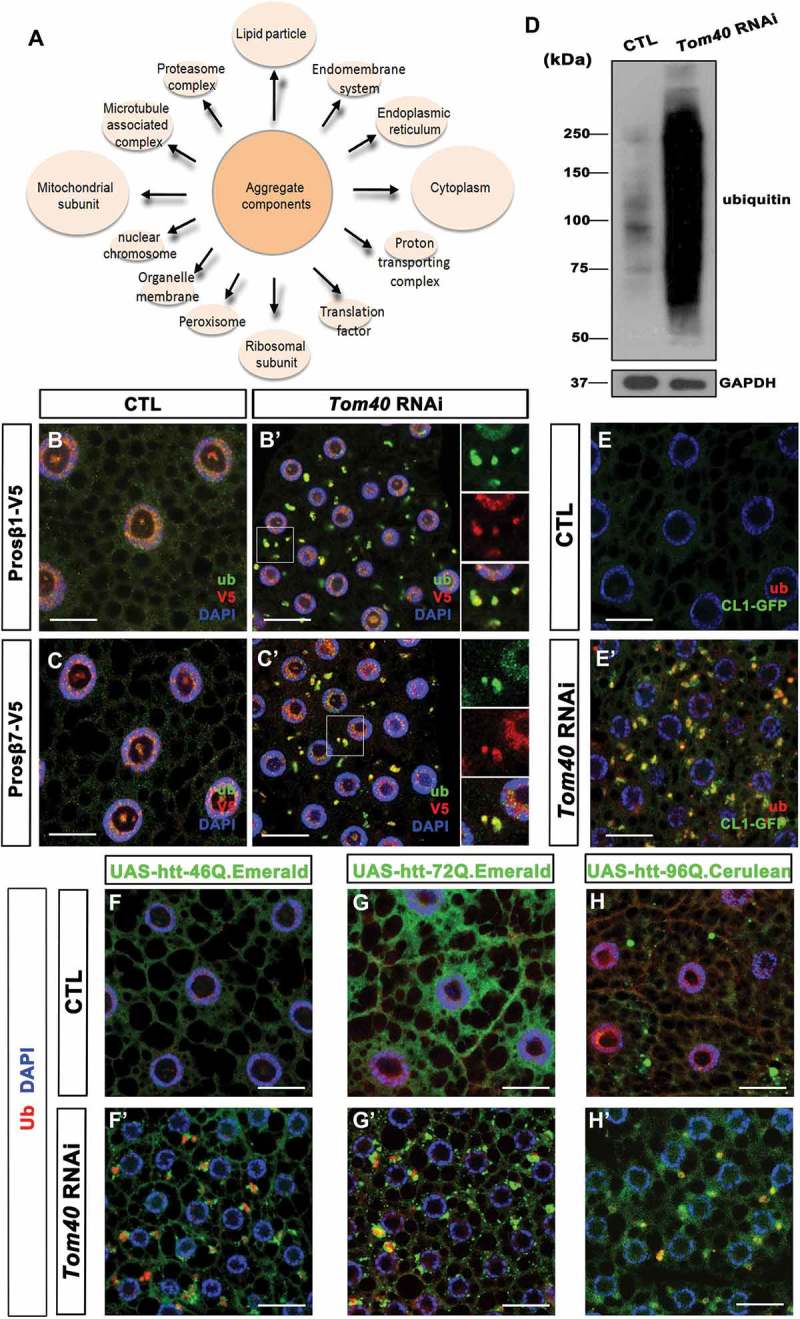
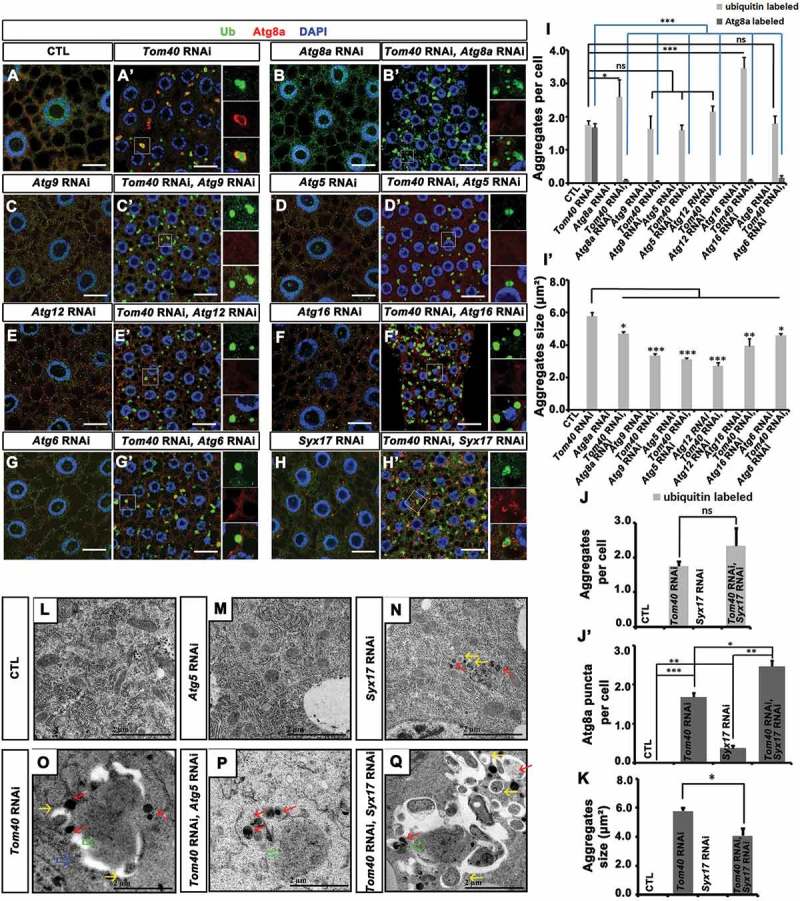
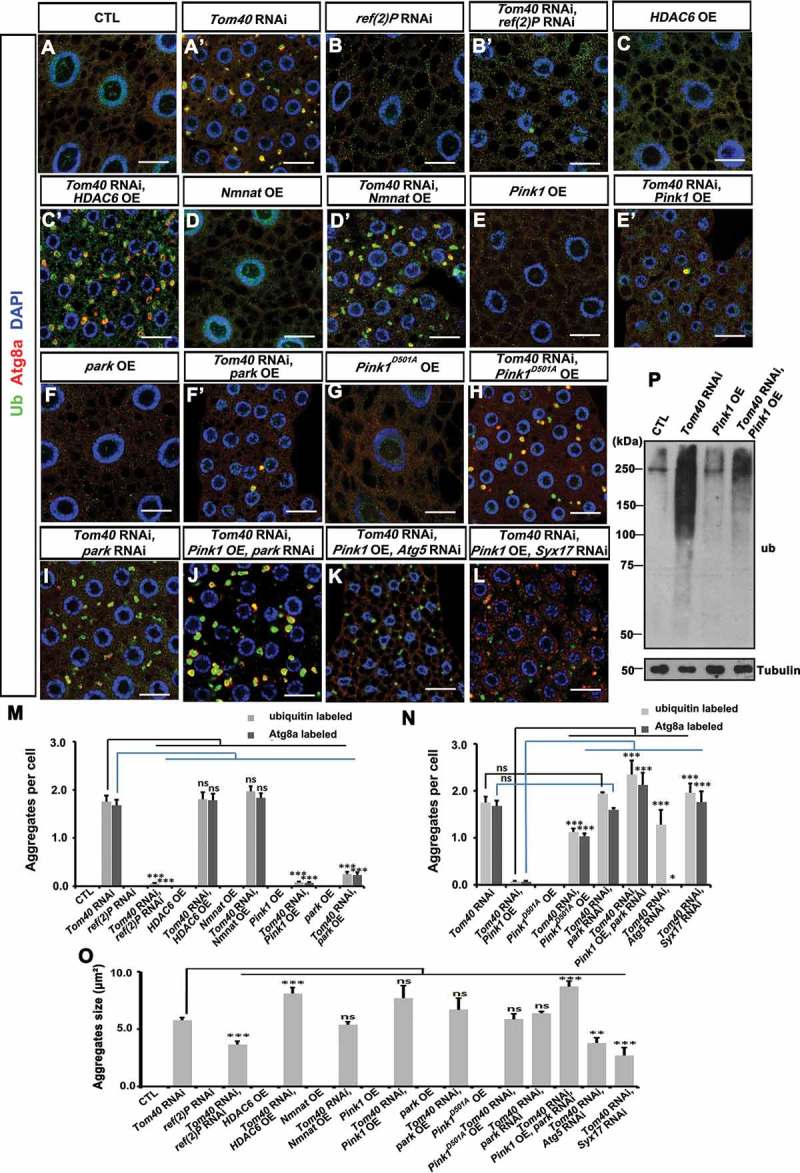
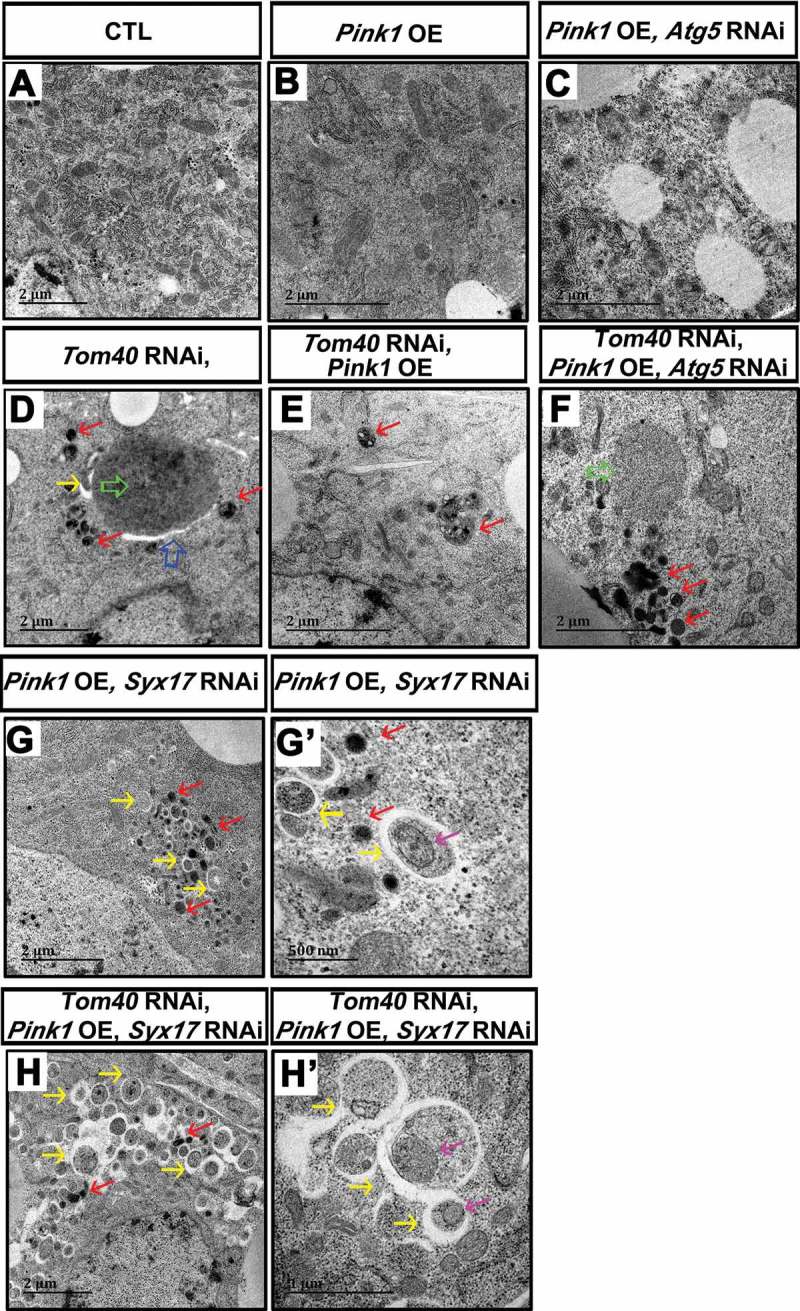
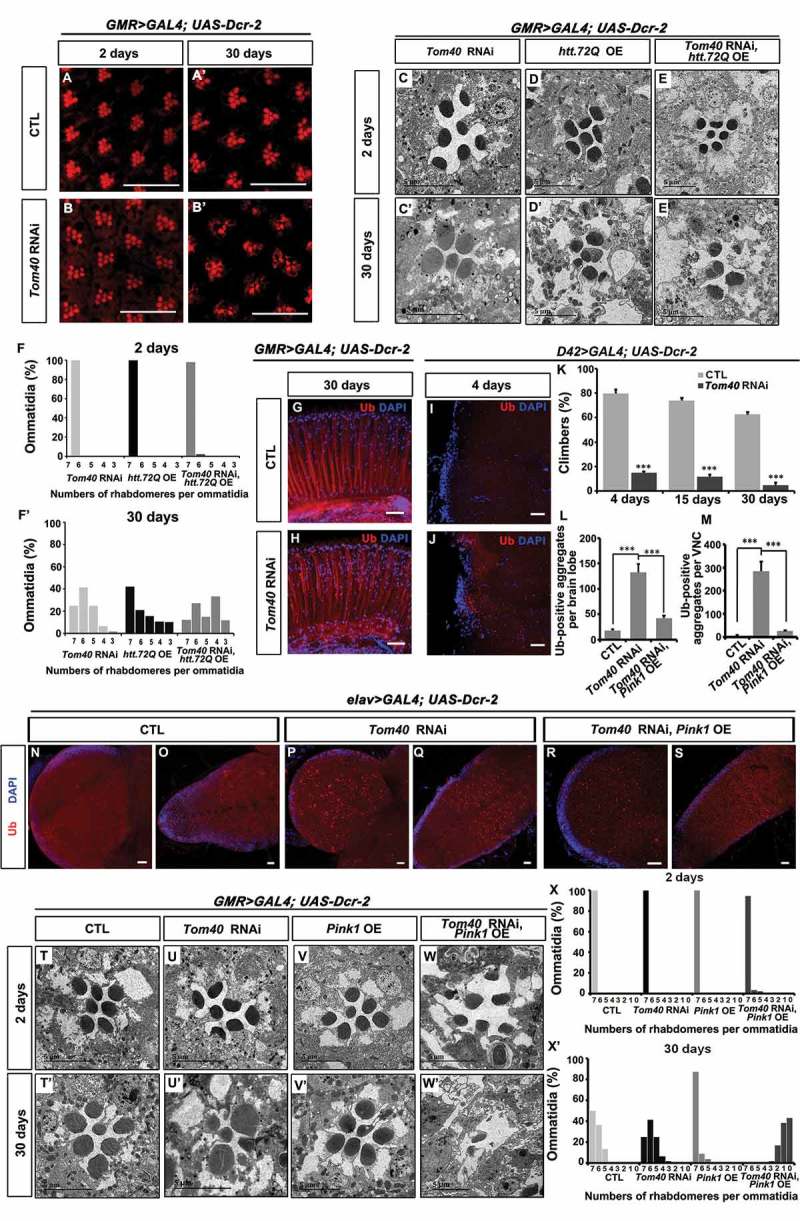
Neurodegeneration is characterized by protein aggregate deposits and mitochondrial malfunction. Reduction in Tom40 (translocase of outer membrane 40) expression, a key subunit of the translocase of the outer mitochondrial membrane complex, led to accumulation of ubiquitin (Ub)-positive protein aggregates engulfed by Atg8a-positive membranes. Other macroautophagy markers were also abnormally accumulated. Autophagy was induced but the majority of autophagosomes failed to fuse with lysosomes when Tom40 was downregulated. In Tom40 RNAi tissues, autophagosome-like (AL) structures, often not sealed, were 10 times larger than starvation induced autophagosomes. Atg5 downregulation abolished Tom40 RNAi induced AL structure formation, but the Ub-positive aggregates remained, whereas knock down of Syx17, a gene required for autophagosome-lysosome fusion, led to the disappearance of giant AL structures and accumulation of small autophagosomes and phagophores near the Ub-positive aggregates. The protein aggregates contained many mitochondrial preproteins, cytosolic proteins, and proteasome subunits. Proteasome activity and ATP levels were reduced and the ROS levels was increased in Tom40 RNAi tissues. The simultaneous inhibition of proteasome activity, reduction in ATP production, and increase in ROS, but none of these conditions alone, can mimic the imbalanced proteostasis phenotypes observed in Tom40 RNAi cells. Knockdown of ref(2)P or ectopic expression of Pink1 and park greatly reduced aggregate formation in Tom40 RNAi tissues. In nerve tissues, reduction in Tom40 activity leads to aggregate formation and neurodegeneration. Rather than diminishing the neurodegenerative phenotypes, overexpression of Pink1 enhanced them. We proposed that defects in mitochondrial protein import may be the key to linking imbalanced proteostasis and mitochondrial defects.

Abbreviations: AL: autophagosome-like; Atg12: Autophagy-related 12; Atg14: Autophagy-related 14; Atg16: Autophagy-related 16; Atg5: Autophagy-related 5; Atg6: Autophagy-related 6; Atg8a: Autophagy-related 8a; Atg9: Autophagy-related 9; ATP: adenosine triphosphate; Cas9: CRISPR associated protein 9; cDNA: complementary DNA; COX4: Cytochrome c oxidase subunit 4; CRISPR: clustered regularly interspaced short palindromic repeats; Cyt-c1: Cytochrome c1; DAPI: 4,6-diamidino-2-phenylindole dihydrochloride; Dcr-2: Dicer-2; FLP: Flippase recombination enzyme; FRT: FLP recombination target; GFP: green fluorescent protein; GO: gene ontology; gRNA: guide RNA; Hsp60: Heat shock protein 60A; HDAC6: Histone deacetylase 6; htt: huntingtin; Idh: Isocitrate dehydrogenase; IFA: immunofluorescence assay; Irp-1A: Iron regulatory protein 1A; kdn: knockdown; Marf: Mitochondrial assembly regulatory factor; MitoGFP: Mitochondrial-GFP; MS: mass spectrometry; MTPAP: mitochondrial poly(A) polymerase; Nmnat: Nicotinamide mononucleotide adenylyltransferase; OE: overexpression; Pink1/PINK1: PTEN-induced putative kinase 1; polyQ: polyglutamine; PRKN: parkin RBR E3 ubiquitin protein ligase; Prosα4: proteasome α4 subunit; Prosβ1: proteasome β1 subunit; Prosβ5: proteasome β5 subunit; Prosβ7: proteasome β7 subunit; ref(2)P: refractory to sigma P; RFP: red fluorescent protein; RNAi: RNA interference; ROS: reactive oxygen species; Rpn11: Regulatory particle non-ATPase 11; Rpt2: Regulatory particle triple-A ATPase 2; scu: scully; sicily: severe impairment of CI with lengthened youth; sesB: stress-sensitive B; Syx17: Syntaxin17; TEM: transmission electron microscopy; ttm50: tiny tim 50; Tom: translocase of the outer membrane; Tom20: translocase of outer membrane 20; Tom40: translocase of outer membrane 40; Tom70: translocase of outer membrane 70; UAS: upstream active sequence; Ub: ubiquitin; VNC: ventral nerve cord; ZFYVE1: zinc finger FYVE-type containing 1.

Keywords: Autophagy; TOM Complex; drosophila; mitochondria; neurodegeneration; proteinaggregates.


Figures

Figure 1.
Figure 1.
Tom40 RNAi led to autophagy defects in fly fat-body tissues. (A, A’) Early third-instar larvae fat-body tissues of the fed wild-type (CTL) (A) and Tom40 RNAi (A’) animals were dissected and stained with anti-Atg8a (red), and anti-Ub antibodies (green). (A’ inset) shows the detailed structures of the aggregates in Tom40 RNAi cells. Ub-positive aggregates were accumulated and wrapped with Atg8a-positive membranes. (B to G’) GFP-tagged various autophagy markers were expressed in fat-body tissues of CTL or Tom40 RNAi animals. GFP signals are green. (H, H’) Wild-type (CTL) and Tom40 RNAi fat-body tissues were stained with anti-ref(2)P (green) and anti-Atg8a (red). (I, I’) GFP-RFP-Atg8a was expressed in CTL or Tom40 RNAi fat-body tissues, most of the GFP (green) and RFP (red) signals colocalized. (J, J’) Lamp1GFP was expressed in CTL and Tom40 RNAi fat-body tissues. Most of the Atg8a (red) signals did not colocalize with GFP (green). DAPI staining marked the nuclei. The scale bar for the immunofluorescence assay (IFA) images: 20 μm. (K to M) TEM of the CTL and Tom40 RNAi fat-body tissues was analyzed. Pink arrows indicate lipid droplets. Large autophagosome like structures (blue arrows) surrounded the electron-dense materials, often adjacent to lysosome-like structures (red arrows) in the Tom40 RNAi fat-body cells. There were a few small autophagosomes (yellow arrows) that near or attached to the large double-membrane envelope. (See also Figure S1.).
Figure 2.
Figure 2.
Mitochondrial protein transport defects but not several other mitochondrial deficiencies led to autophagy defects. (A to C) Anti-Ub (green) and anti-Atg8a (red) antibody staining of the fat-body tissues of control (CTL), Tom20 RNAi, and Tom40 RNAi flies were shown. Nuclei were marked with DAPI (blue) staining. (D to L) GFP-Atg8a was expressed in fat-body tissues of the flies with the indicated genotypes. The CTL clone and the indicated mutant clones were negatively marked by RFP (red). The GFP-Atg8a signals (green) and anti-Ub antibody staining (blue) of the fat-body tissues are shown. Scale bar: 20 μm. (See also Figure S2.).
Figure 3.
Figure 3.
Different mitochondrial proteins or precursors have different fates in Tom40 RNAi tissues. (A and A’, G to I’, M to O’) The indicated tagged-form mitochondrial proteins and preproteins were expressed in wild-type (CTL) or Tom40 RNAi fat-body tissues. GFP, anti-V5, or anti-HA antibody staining (green) of the fat-body cells with the indicated genotypes are shown. DAPI (blue) staining marked the nuclei. The scale bar for the IFA images: 20 μm. (D to F’, J to L’, P to R’) Western blots of the fat body tissues of the indicated genotypes are shown to indicate the amount of the indicated proteins. Tubulin was used as a loading control. The quantification of the western blot results is shown as charts below individual western blot panels. (See also Figure S3.).
Figure 4.
Figure 4.
Proteasome subunits are accumulated in the aggregates and proteasome activity is reduced in Tom40 RNAi tissues. (A) The aggregates isolated from Tom40 RNAi tissues were analyzed by mass spectrometry. The identified proteins were analyzed by gene ontology (GO) enrichment analysis to reveal the major cellular components that they were belonging. (B to C’) Proteasome subunits Prosβ1-V5 and Prosβ7-V5 were expressed in both wild-type cells (CTL) and Tom40 RNAi cells. Anti-V5 (red) and anti-Ub (green) staining of fat-body cells with the indicated genotypes is shown. (D) Western blot of Ub-positive protein species in both CTL and Tom40 RNAi tissues. GAPDH level was probed as loading control. (E and E’) CL1-GFP (green) was expressed in CTL and Tom40 RNAi tissues. GFP fluorescence and anti-Ub (red) antibody staining are shown for the indicated genotypes. (F to H’) The indicated htt PolyQ proteins were expressed in CTL and Tom40 RNAi fat-body tissues. Green fluorescence (green) of the indicated htt PolyQ fluorescence proteins and anti-Ub (red) antibody staining of the fat-body tissues with the indicated genotypes are shown. Nuclei are marked by DAPI (blue) staining. The scale bar for the IFA images: 20 μm. (See also Figure S3, S4, Table S1.).
Figure 5.
Figure 5.
Inhibtion of autophagy in Tom40 RNAi tissues reduced aggregate size and blocked engulfing aggregates by phagophore membrane. (A to H’) Anti-Atg8a (red) and anti-Ub (green) antibody staining of the fat-body tissues with the indicated genotypes. Nuclei are marked by DAPI (blue) staining. The scale bar for the IFA images: 20 μm. (I to K) The quantification of the number and size of Ub and Atg8a-positive aggregates in the tissues with the indicated genotypes. ns: not significant; *: < 0.05; **: < 0.01; ***: < 0.001. (L to Q) The TEM analysis of the fat-body tissues in the animals with the indicated genotypes. CTL (control). The blue arrow indicated the giant autophagosome-like structure in Tom40 RNAi tissues. The green arrows indicate the protein aggregates. The red arrows indicate lysosomes. The yellow arrows indicate small sealed autophagosomes.
Figure 6.
Figure 6.
ref(2)P RNAi and Pink1-park overexpression reduce the formation of protein aggregates in Tom40 RNAi tissues. (A to L) Fat-body tissues from the animals of the indicated genotypes were stained with anti-Ub (green) and anti-Atg8a (red) antibodies. Nuclei were marked by DAPI (blue) staining. The scale bar for the IFA images: 20 μm. (M to O) The number and size of Ub- and Atg8a-positive aggregates in the fat-body tissues were quantified for the indicated genotypes. OE, overexpression; ns, not significant; *, < 0.05; **, < 0.01; ***, < 0.001. (P) The ubiquitinated protein species in the fat-body tissues of the animals with the indicated genotypes were analyzed by western blot. Tubulin was used as a loading control.
Figure 7.
Figure 7.
TEM analysis of the fat-body tissues in the animals with the indicated genotypes. The size of scale bar was labeled in each individual image. (G) and (G’) were tissues from animals with the same genotypes. The magnification of (G’) is larger than that of (G). (H) and (H’) were tissues from animals with the same genotypes. The magnification of (H’) is larger than that of (H). The blue arrow indicates the giant autophagosome-like structure in Tom40 RNAi tissues. The green arrows indicate the protein aggregates. The red arrows indicate lysosomes. The yellow arrows indicate small autophagosomes. The mitochondria-like structures inside autophagosomes are indicated by pink arrows. (See also Figure S5.).
Figure 8.
Figure 8.
Reducing aggregates by overexpressing Pink1 enhances the neurodegeneration phenotypes in Tom40 RNAi animals. (A to B’) To knockdown Tom40 in the eye, GMR-Gal4 was used to drive Dcr-2 (Dicer-2) and Tom40 RNAi transgene expressing. The adult fly eyes of CTL and Tom40 RNAi animals were analyzed by phalloidin staining (red) at day 2 or day 30 after eclosion. (C to E’) The adult fly eyes with Tom40 RNAi and htt72Q overexpression (OE) individually or together were analyzed by TEM at day 2 or day 30 after eclosion. (F, F’) The TEM images of the 2-day- or 30-day-old adult fly eyes with the indicated genotypes were quantified by the percentage of ommatidia with the indicated numbers of rhabdomeres per ommatidia. (G, H) The adult eyes from 30-day-old CTL and Tom40 RNAi animals were stained with anti-Ub antibody (red) and DAPI (blue). (I to K) To knock down Tom40 in the motor neurons, D42-Gal4 was used to drive Dcr-2 and Tom40 RNAi transgene expression. (I, J) The 4-day-old adult ventral ganglia were stained with anti-Ub antibody (red) and DAPI (blue). (K) The climbing abilities of CTL and D42 Gal4> Tom40 RNAi animals were analyzed at different days after eclosion. ***: < 0.001. (L to S) Pan-neural Elav-Gal4 was used to drive Dcr-2 and Tom40 RNAi transgene expression with or without Pink1 expression (OE) in neurons. (N to S) The third-instar larvae brain lobes and VNCs with the indicated genotypes were stained with anti-Ub (red) antibody and DAPI (blue) to analyze the Ub-positive protein species in the nerve system. (L, M) The Ub-positive protein aggregates in the brain lobes or VNCs of the animals with the indicated genotypes were quantified. ***: < 0.001. (T to X’) The TEM analysis of the adult fly retina in the animals with the indicated genotypes at 2 days or 30 days after eclosion. (X, X’) The TEM images of the 2-day- or 30-day-old adult fly eyes with the indicated genotypes were quantified by the percentage of ommatidia with the indicated numbers of rhabdomeres per ommatidia. The scale bar for the IFA images: 20 μm. (See also Figure S7, S8 and S9.).

Similar articles

Cited by

References

    1. Nunnari J, Suomalainen A.. Mitochondria: in sickness and in health. Cell. 2012. March 16;148(6):1145–1159. S0092-8674(12)00235-8 [pii]. PubMed PMID: 22424226; eng. - PMC - PubMed
    1. Mishra P, Chan DC.. Mitochondrial dynamics and inheritance during cell division, development and disease. Nat Rev Mol Cell Biol. 2014. October;15(10):634–646. nrm3877 [pii]. PubMed PMID: 25237825; PubMed Central PMCID: PMC4250044. eng. - PMC - PubMed
    1. Youle RJ, van der Bliek AM. Mitochondrial fission, fusion, and stress. Science. 2012. August 31;337(6098):1062–1065. 337/6098/1062 [pii]. PubMed PMID: 22936770; eng. - PMC - PubMed
    1. Dodson MW, Guo M. Pink1, Parkin, DJ-1 and mitochondrial dysfunction in Parkinson’s disease. Curr Opin Neurobiol. 2007. June;17(3):331–337. S0959-4388(07)00064-5 [pii]. PubMed PMID: 17499497; eng. - PubMed
    1. Koopman WJ, Distelmaier F, Smeitink JA, et al. OXPHOS mutations and neurodegeneration. EMBO J. 2013. January 9;32(1):9–29. emboj2012300 [pii]. PubMed PMID: 23149385; PubMed Central PMCID: PMC3545297. eng. - PMC - PubMed

Publication types

MeSH terms