

A Transparent and Consistent Approach to Assess US Outpatient Drug Costs for Use in Cost-Effectiveness Analyses
- PMID: 29909872
- PMCID: PMC6394851
- DOI: 10.1016/j.jval.2017.06.013
A Transparent and Consistent Approach to Assess US Outpatient Drug Costs for Use in Cost-Effectiveness Analyses
Abstract
Background: Assessment of drug costs for cost-effectiveness analyses (CEAs) in the United States is not straightforward because the prices paid for drugs are not publicly available and differ between payers. CEAs have relied on list prices that do not reflect the rebates and discounts known to be associated with these purchases.
Objectives: To review available cost measures and propose a novel strategy that is transparent, consistent, and applicable to all CEAs taking a US health care sector perspective or a societal payer's perspective.
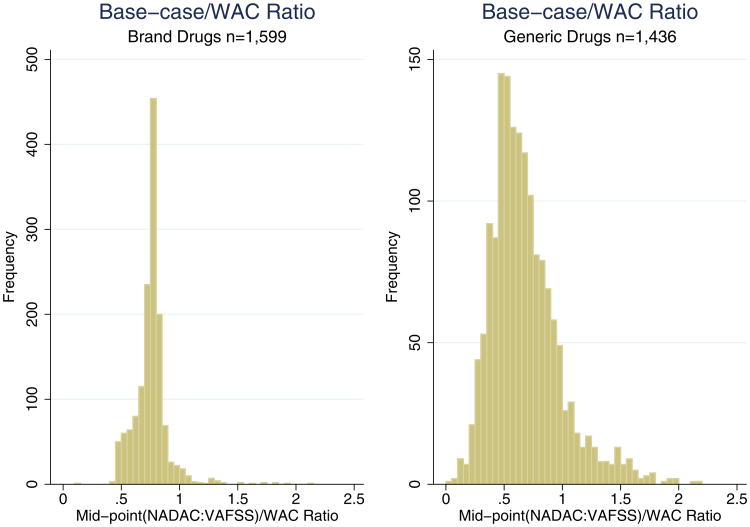
Methods: We propose using the National Average Drug Acquisition Cost (NADAC), the Veterans Affairs Federal Supply Schedule (VAFSS), and their midpoint as the upper bound, lower bound, and base case, respectively, to estimate net drug prices for various payers. We compare this approach with wholesale acquisition cost (WAC), the most common measure observed in our literature review. The minimum WAC is used to provide the most conservative comparison.
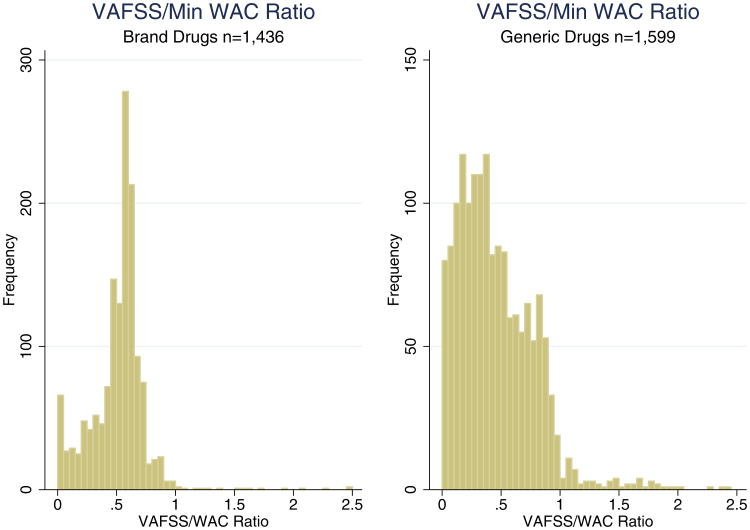
Results: Our sample consists of 1436 brand drugs and 1599 generic drugs. On average, the upper bound (NADAC) is 1% and 9.8% lower than the WAC for brand and generic drugs respectively, whereas the lower bound (VAFSS) is 48.3% and 54.2% lower than the WAC. The NADAC is less than the WAC in 89.6% of drug groups. The distributions of these relationships do not show a clear mode and have wide variation.
Conclusions: Our study suggests that the WAC may be an overestimate for the base case because the minimum WAC is higher than the NADAC for most drugs. Our approach balances uncertainty and lack of data for the cost of pharmaceuticals with the need for a transparent and consistent approach for valid CEAs.
Keywords: United States; cost-effectiveness analysis; drug cost; health economic methods.
Copyright © 2018 International Society for Pharmacoeconomics and Outcomes Research (ISPOR). Published by Elsevier Inc. All rights reserved.
Conflict of interest statement
Conflicts of interest: The authors have indicated that they have no conflicts of interest with regard to the content of this article.
Figures

Similar articles
-
OSTEOPOROSIS DRUGS MARKETED IN THE UNITED STATES: GENERIC COMPETITION, PRICING STRUCTURE, AND DISPERSION AMONG PAYERS.Int J Technol Assess Health Care. 2016 Jan;32(6):385-392. doi: 10.1017/S0266462316000623. Epub 2017 Jan 9. Int J Technol Assess Health Care. 2016. PMID: 28065194
-
Good research practices for measuring drug costs in cost effectiveness analyses: issues and recommendations: the ISPOR Drug Cost Task Force report--Part I.Value Health. 2010 Jan-Feb;13(1):3-7. doi: 10.1111/j.1524-4733.2009.00663.x. Epub 2009 Oct 28. Value Health. 2010. PMID: 19874571
-
Estimating Drug Costs: How do Manufacturer Net Prices Compare with Other Common US Price References?Pharmacoeconomics. 2018 Sep;36(9):1093-1099. doi: 10.1007/s40273-018-0667-9. Pharmacoeconomics. 2018. PMID: 29752675 Free PMC article.
-
The High Cost of Prescription Drugs in the United States: Origins and Prospects for Reform.JAMA. 2016 Aug 23-30;316(8):858-71. doi: 10.1001/jama.2016.11237. JAMA. 2016. PMID: 27552619 Review.
-
Do Cost-Effectiveness Analyses Account for Drug Genericization? A Literature Review and Assessment of Implications.Value Health. 2022 Jan;25(1):59-68. doi: 10.1016/j.jval.2021.06.014. Epub 2021 Nov 12. Value Health. 2022. PMID: 35031100 Review.
Cited by
-
Cost-effectiveness analysis of initial treatment with single-pill combination antihypertensive medications.J Hum Hypertens. 2023 Nov;37(11):985-992. doi: 10.1038/s41371-023-00811-3. Epub 2023 Feb 15. J Hum Hypertens. 2023. PMID: 36792728 Free PMC article.
-
Comparison of US and EU Prices for Orphan Drugs in the Perspective of the Considered US Orphan Drugs Act Modifications and Discussed Price-Regulation Mechanisms Adjustments in US and European Union.Int J Environ Res Public Health. 2022 Sep 24;19(19):12098. doi: 10.3390/ijerph191912098. Int J Environ Res Public Health. 2022. PMID: 36231399 Free PMC article.
-
Industry Payments to Physicians and Prescribing Branded Memantine and Donepezil Combination.Neurol Clin Pract. 2021 Jun;11(3):181-187. doi: 10.1212/CPJ.0000000000000870. Neurol Clin Pract. 2021. PMID: 34484885 Free PMC article.
-
Cost-Effectiveness Analysis Methods Used in Evaluations of Treatment for Cystic Fibrosis: A Scoping Review.Pharmacoeconomics. 2025 Jul;43(7):711-721. doi: 10.1007/s40273-025-01497-w. Epub 2025 Apr 29. Pharmacoeconomics. 2025. PMID: 40301297
-
Identifying characteristics for a cost-effective psoriatic arthritis biomarker test: a development-focused health technology assessment.Int J Technol Assess Health Care. 2025 May 23;41(1):e29. doi: 10.1017/S0266462325000091. Int J Technol Assess Health Care. 2025. PMID: 40405745 Free PMC article.
References
-
- Glick HA, Doshi JA, Sonnad SS, et al. Economic Evaluation in Clinical Trials. Oxford, UK: Oxford University Press; 2014.
-
- Briggs AH, Claxton K, Sculpher MJ. Decision Modelling for Health Economic Evaluation. Oxford, UK: Oxford University Press; 2006.
-
- Keehan SP, Poisal JA, Cuckler GA, et al. National health expenditure projections, 2015–25: economy, prices, and aging expected to shape spending and enrollment. Health Aff (Millwood) 2016;35:1522–31. - PubMed
-
- Neumann PJ, Sanders GD, Russell LB, et al. Cost-Effectiveness in Health and Medicine. Oxford, UK: Oxford University Press; 2016.
Publication types
MeSH terms
Substances
Grants and funding
LinkOut - more resources
Full Text Sources
Other Literature Sources
