

Development of Methods for the Mapping of Utilities Using Mixture Models: Mapping the AQLQ-S to the EQ-5D-5L and the HUI3 in Patients with Asthma
- PMID: 29909881
- PMCID: PMC6026598
- DOI: 10.1016/j.jval.2017.09.017
Development of Methods for the Mapping of Utilities Using Mixture Models: Mapping the AQLQ-S to the EQ-5D-5L and the HUI3 in Patients with Asthma
Abstract
Background: Studies have shown that methods based on mixture models work well when mapping clinical to preference-based methods.
Objectives: To develop these methods in different ways and to compare performance in a case study.
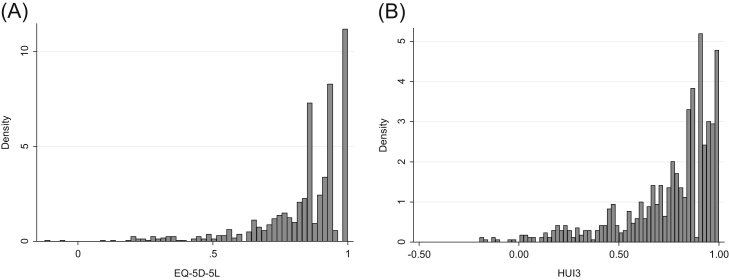
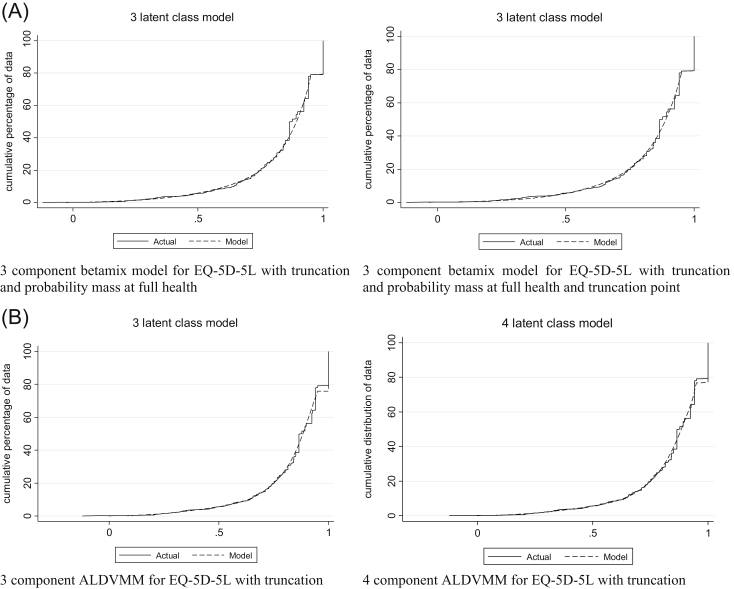
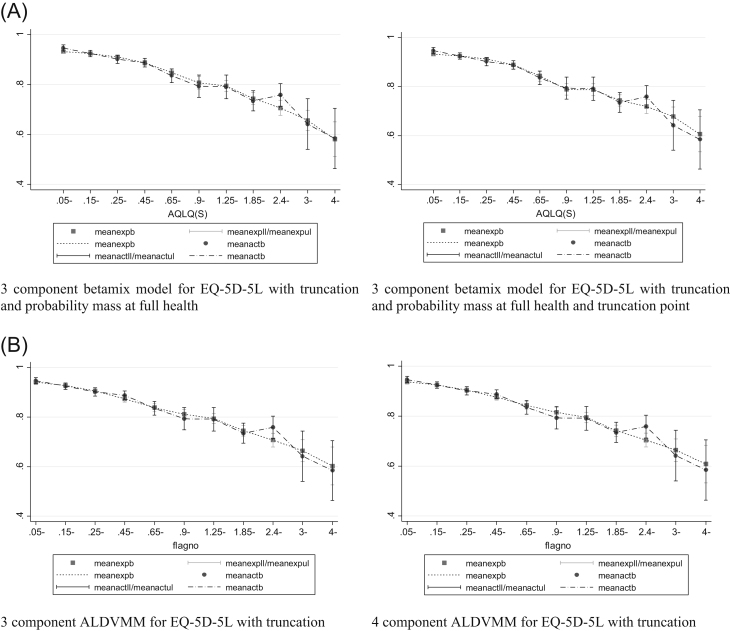
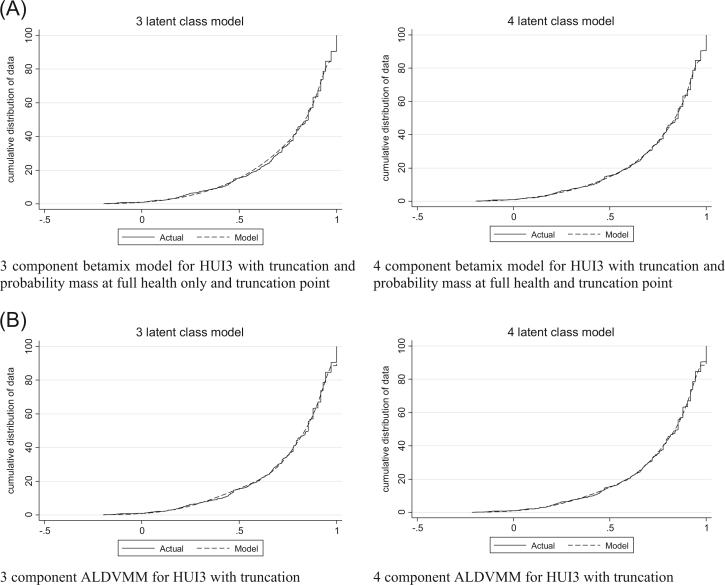
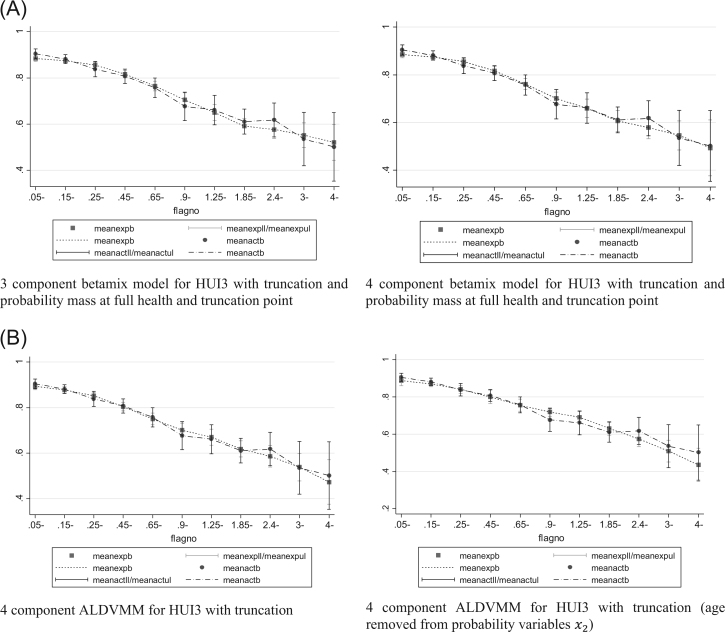
Methods: Data from 856 patients with asthma allowed mapping between the Asthma Quality of Life Questionnaire and both the five-level EuroQol five-dimensional questionnaire (EQ-5D-5L) and the health utilities index mark 3 (HUI3). Adjusted limited dependent variable mixture models and beta-based mixture models were estimated. Optional inclusion of the gap between full health and the next value as well as a mass point at the next feasible value were explored.
Results: In all cases, model specifications formally modeling the gap between full health and the next feasible value were an improvement on those that did not. Mapping to the HUI3 required more components in the mixture models than did mapping to the EQ-5D-5L because of its uneven distribution. The optimal beta-based mixture models mapping to the HUI3 included a probability mass at the utility value adjacent to full health. This is not the case when estimating the EQ-5D-5L, because of the low proportion of observations at this point.
Conclusions: Beta-based mixture models marginally outperformed adjusted limited dependent variable mixture models with the same number of components in this data set. Nevertheless, they require a larger number of parameters and longer estimation time. Both mixture model types closely fit both EQ-5D-5L and HUI data. Standard mapping approaches typically lead to biased estimates of health gain. The mixture model approaches exhibit no such bias. Both can be used with confidence in applied cost-effectiveness studies. Future mapping studies in other disease areas should consider similar methods.
Keywords: EQ-5D; HUI; mapping; utility.
Copyright © 2018 International Society for Pharmacoeconomics and Outcomes Research (ISPOR). Published by Elsevier Inc. All rights reserved.
Figures
References
-
- Buxton M.J. Economic evaluation and decision making in the UK. Pharmacoeconomics. 2006;24:1133–1142. - PubMed
-
- Kearns B., Ara R., Wailoo A. Good practice guidelines for the use of statistical regression models in economic evaluations. Pharmacoeconomics. 2013;31:643–652. - PubMed
-
- Apfelbacher C.J., Hankins M., Stenner P. Measuring asthma-specific quality of life: structured review. Eur J Allergy Clin Immunol. 2011;66:439–457. - PubMed
Publication types
MeSH terms
Substances
Grants and funding
LinkOut - more resources
Full Text Sources
Other Literature Sources
Medical
Miscellaneous
