. 2018 Jun 28;174(1):156-171.e16.
doi: 10.1016/j.cell.2018.05.027. Epub 2018 Jun 14.

A Milieu Molecule for TGF-β Required for Microglia Function in the Nervous System

Affiliations

A Milieu Molecule for TGF-β Required for Microglia Function in the Nervous System

Yan Qin et al. Cell. .

Abstract

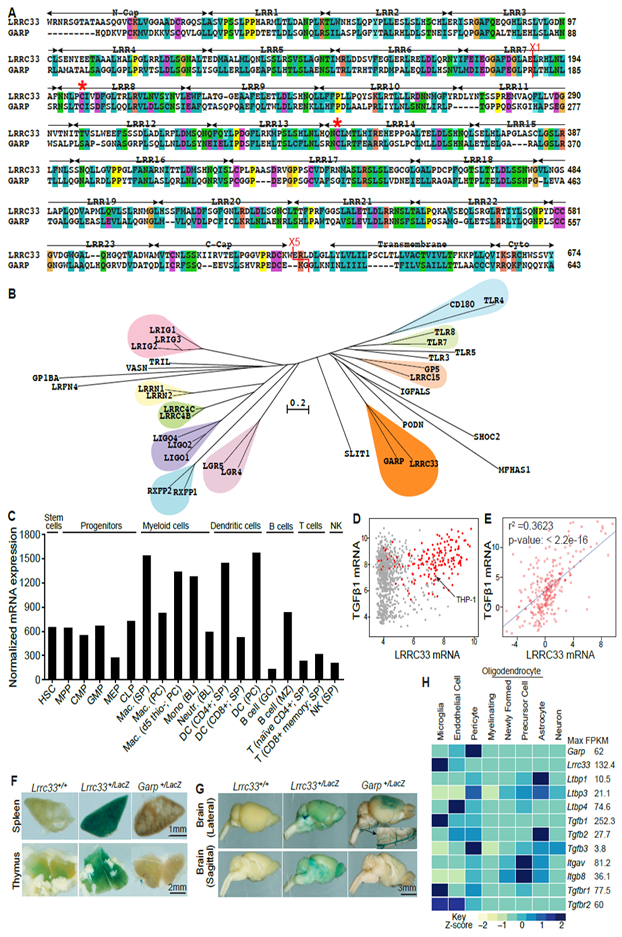
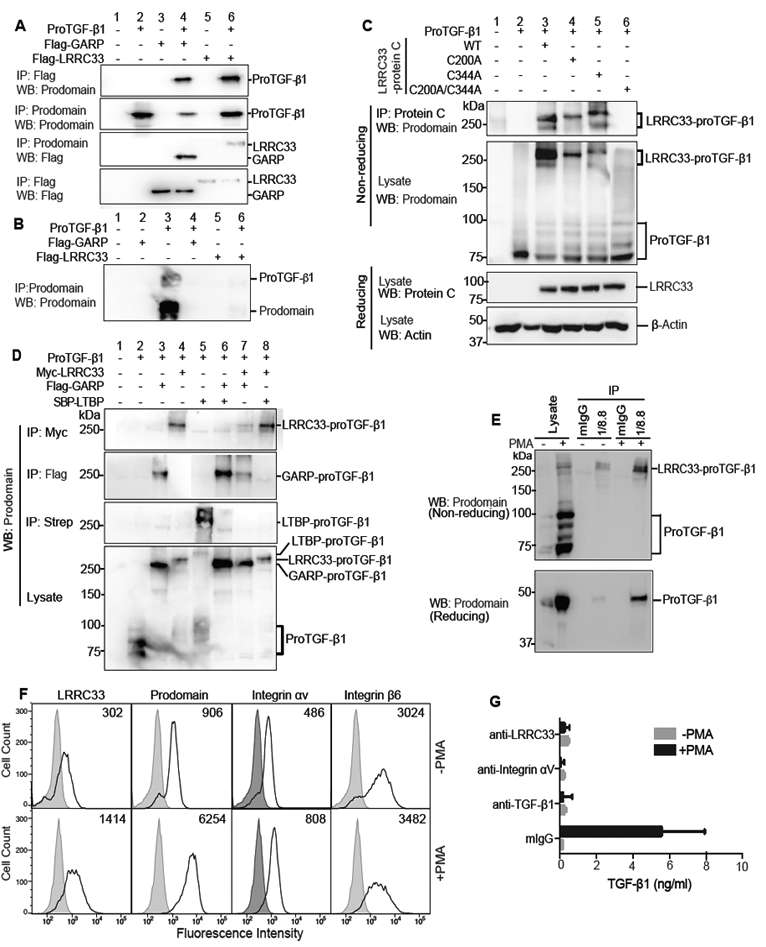
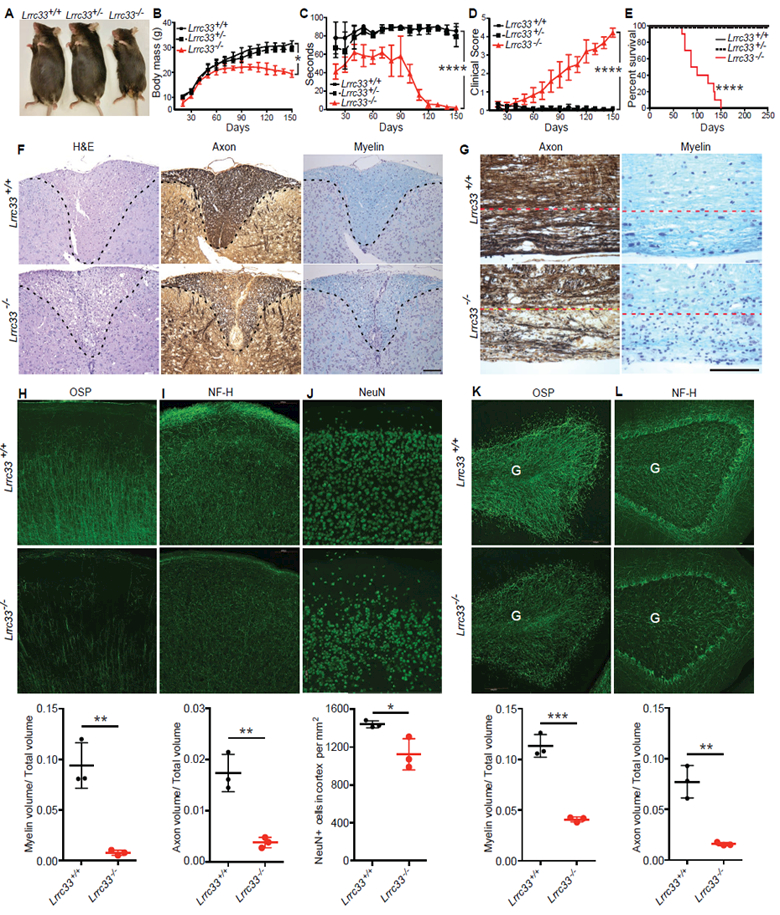
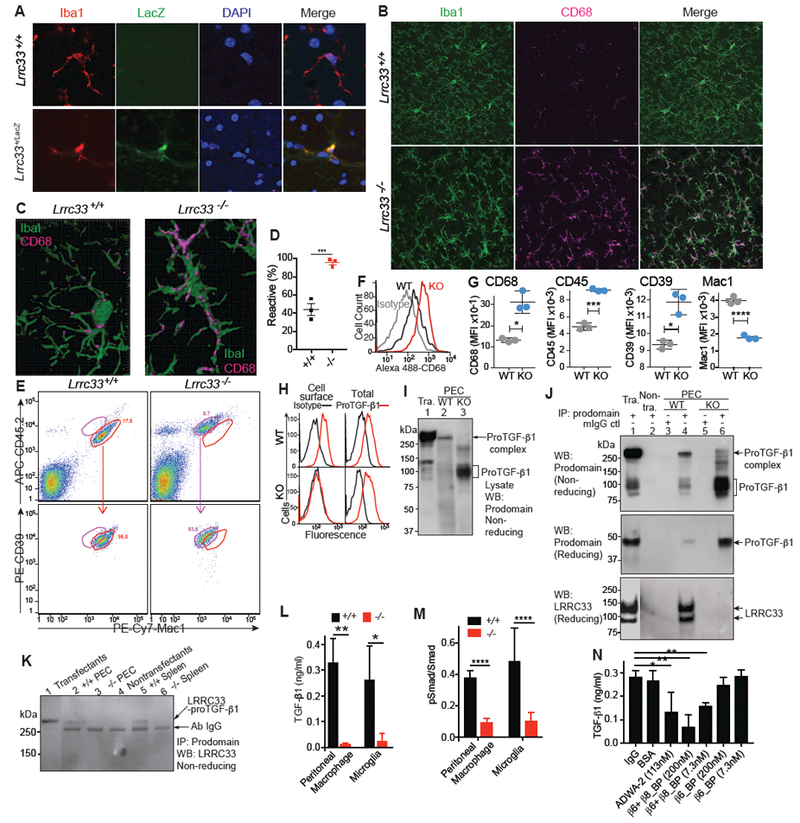
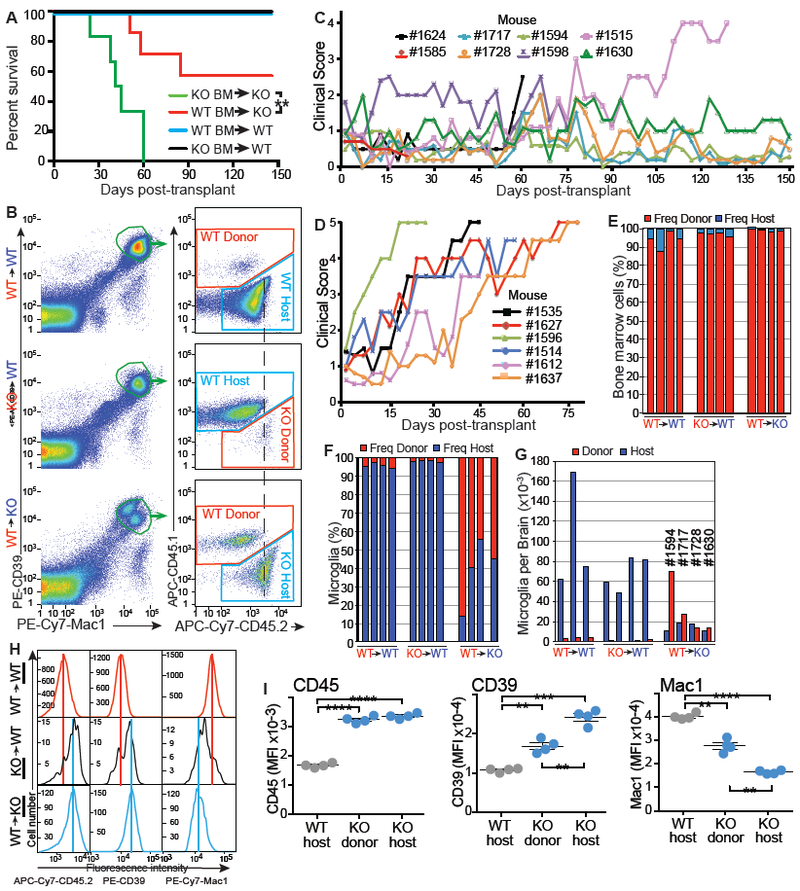
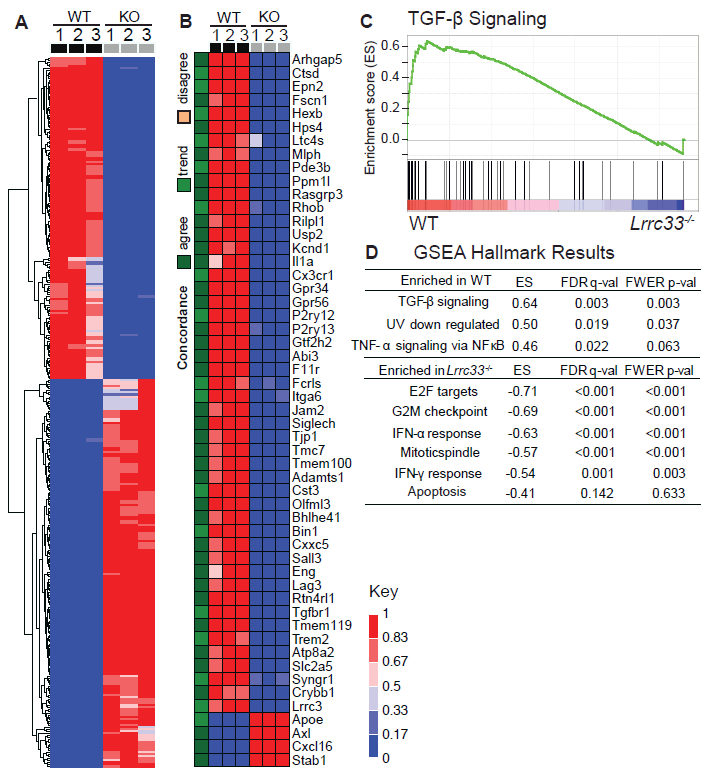
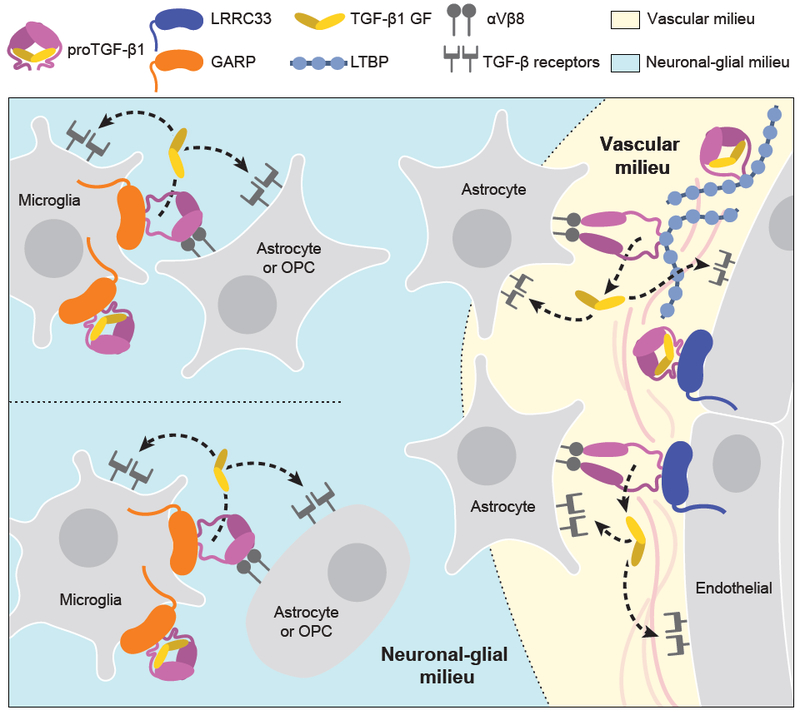
Extracellular proTGF-β is covalently linked to "milieu" molecules in the matrix or on cell surfaces and is latent until TGF-β is released by integrins. Here, we show that LRRC33 on the surface of microglia functions as a milieu molecule and enables highly localized, integrin-αVβ8-dependent TGF-β activation. Lrrc33-/- mice lack CNS vascular abnormalities associated with deficiency in TGF-β-activating integrins but have microglia with a reactive phenotype and after 2 months develop ascending paraparesis with loss of myelinated axons and death by 5 months. Whole bone marrow transplantation results in selective repopulation of Lrrc33-/- brains with WT microglia and halts disease progression. The phenotypes of WT and Lrrc33-/- microglia in the same brain suggest that there is little spreading of TGF-β activated from one microglial cell to neighboring microglia. Our results suggest that interactions between integrin-bearing cells and cells bearing milieu molecule-associated TGF-β provide localized and selective activation of TGF-β.

Keywords: LRRC33; TGF-β; integrins; microglia; milieu molecules.


Conflict of interest statement

Declaration of interests disclosure: Y.Q., A.J., C.L., and T.A.S. are inventors on a patent on LRRC33 that may be licensed. T.A.S. owns stock in Scholar Rock.

Figures

Figure 1.
Figure 1.. LRRC33 homology to GARP and tissue-specific expression.
(A) Sequence alignment. Red asterisks (*) mark cysteines that disulfide link to proTGF-β1 (Wang et al., 2012). X1 and X5 mark GARP/LRRC33 chimaera exchange positions. (B) Phylogram of closest LRR-superfamily relatives of LRRC33. Trees were calculated with the NJ method on ectodomains aligned with MAFFT (G-INS-i, gap insertion and extension penalties of 3 and 1, respectively). (C) LRRC33 mRNA expression in murine hematopoietic cells from the ImmGen microarray database. (D) LRRC33 and TGF-β1 mRNA expression in human cancer cell lines in the Cancer Cell Line Encyclopedia; red dots: haematopoietic cell lines. (E) LRRC33 and TGF-β1 mRNA levels positively correlate in normal human tissue, datasets from BioGPS. (F, G) X-gal staining showing LacZ expression in 4-month-old WT, Lrrc33+/ and Garp+/ heterozygous mice. (H) Mouse brain RNAseq data (Zhang, 2014); relative gene expression is shown among 8 cell types isolated from the CNS with FPKM (Fragments Per Kilobase of transcript per Million mapped reads) value shown for the highest expressing cell type.
Figure 2.
Figure 2.. LRRC33 association with proTGF-β1 and TGF-β1 activation.
(A and B) Lysates of 293T cells transfected with indicated constructs (A) or culture supernatants (B) were immunoprecipitated (IP) and subjected to reducing SDS 10% PAGE and blotted (WB) as indicated. (C) Disulfide linkage. 293T cells transfected with indicated constructs were subjected to IP, 7.5% non-reducing or 10% reducing SDS-PAGE, and WB as indicated. (D) LRRC33 outcompetes LTBP for proTGF-β1 293T transfectant lysates were IP, subjected to non-reducing SDS 7.5% PAGE, and WB as indicated. (E) LRRC33-proTGF-β1 complex in THP-1 cells. THP-1 cells were treated with or without PMA (80 nM, 24 h) and cell lysates were IP with 1/8.8 to LRRC33 or mouse IgG control, reducing and non-reducing SDS 7.5% PAGE, and WB as indicated. (F) Flow cytometry. THP-1 cells treated with or without PMA were stained with anti-LRRC33 (1/8.8), anti-prodomain (TW4–2F8), anti-integrin αV (17E6) or anti-integrin β6 (7.1G10) and subjected to FACS. Numbers in histograms show specific mean fluorescence intensity. (G) Blockade of active TGF-β1 release. THP-1 cells treated with or without PMA were incubated with antibody 1/8.8 to LRRC33, 17E6 to αV integrin, or MAB240 to TGF-β1 and cocultured with TMLC to measure TGF-β activation. Data represent mean ± SEM of quadruplicate samples.
Figure 3.
Figure 3.. Phenotype and neuropathology of Lrrc33−/− mice.
(A-E) Appearance at 4 months (A), body mass (B), rotarod performance (C), clinical score (D), and Kaplan-Meier survival curve (E) of Lrrc33+/+, Lrrc33+/− and Lrrc33−/− mice. Data are mean ± SEM. P values for last time point (*, <0.05; ****, <0.0001) are from unpaired Student’s t-test (B-D) and log-rank test (E). (F) Demyelination and axon degeneration at 4.5 month in spinal cord dorsal column (area above dashed line). Left panel: H&E stain shows accumulation of foamy macrophages and cholesterol clefts (sign of myelin breakdown) in Lrrc33−/− mice. Middle panel: Bielschowsky’s silver stain. Right panel: Luxol fast blue stain. Scale bar: 1 mm. (G) Demyelination and axon degeneration at 4.5 month in corticospinal tract of brain stem (below dashed line). Left: Bielschowsky’s silver stain. Right: Luxol fast blue stain. Scale bar: 1 mm. (H-L) Fluorescent immunostaining (upper two rows) with quantitation (lower row) of 40 μm sagittal sections at 4 months of somatomotor cortex region M1 (H-J) and cerebellum (K-L). M (molecular) and II/III mark layers of the cerebral cortex. G marks granule cell layer and dashed lines demarcate the Purkinje cell layer in cerebellum. Scale bars: 100 μm. Quantitation in lower row shows mean ± SEM for three mice from measurements averaged over 2–3 sections per mouse with 1–2 images per section. *: P<0.05; **: P<0.01; ***: P<0.001, unpaired t-test.
Figure 4.
Figure 4.. Alterations in microglia, macrophages, and TGF-β complex formation and activation in Lrrc33−/− mice.
(A) Immunostaining of 8 μm brain sections for LacZ and Iba1. (B and C) Immunostaining of 40 μm brain sections for Iba1 and CD68 (B) and 3D reconstruction (C). (D) Quantification of reactive microglia cells in somatomotor cortex region M1, mean ± SEM for n=3 mice; ***P=0.008, two-tailed t-test). (E-G) Immunophenotype of CD45low Mac1high CD39high microglia from day 21 mice and quantification of expression. (E) Representative gating comparing gates for WT (red) and KO (violet) microglia. (F-G). Quantitation with representative histograms for CD68 (F) and mean fluorescence intensity (G, MFI, mean ± SEM, n = 3 mice). *: p=0.012 to 0.02; ***: p=0.006; ****: p=0.0006. (H) Staining of F4/80+ Mac1+ PEC with TGF-β prodomain (TW7–16B4) or control antibodies with or without permeabilization. One representative of 4 mice. (I-K) High MW proTGF-β1 complexes in WT and not Lrrc33−/− cells or transfected (Tra.) or non-transfected (Non-tra.) cells. (I) Anti-proTGF-β1 WB of PEC (106/lane) or 33-G-X5 - proTGF-β1 L1.2 transfectant (105/lane) lysates. (J,K) Lysates from WT and Lrrc33−/− PEC and spleen cells, LRRC33 proTGF-β1 co-transfectants or untransfected cells, with or without IP with prodomain antibody TW7–16B4 or mouse IgG coupled to Sepharose, were subjected to non-reducing or reducing SDS 7.5% PAGE and WB with anti-denatured mouse LRRC33 (Noubade et al., 2014) or anti-proTGF-β1 Ratio of transfectant:native cell equivalents was 1:10. (L) TGF-β activation. PEC from adult WT or Lrrc33−/− mice or 1:1 cocultures of WT astrocytes with WT or Lrrc33−/− microglia were assayed for TGF-β production; N=3 mice, mean ± SEM; **P<0.01, *P<0.05 (unpaired Student’s t-test). (M) pSMAD. PEC and microglia from WT or Lrrc33−/− mice were assayed for fluorescence intensity with SMAD2 and phospho-SMAD2/3 antibodies by In-cell-western. Mean ± SEM; N=3 mice (3 replicates each). ****P<0.0001, unpaired Student’s t-test. (N) Integrin dependence of TGF-β activation. WT astrocyte and microglia co-cultures were assayed for TGF-β production using reporter cells in the presence of indicated inhibitors. Mean ± SEM, N=3 mice (3 replicates each); **P<0.01, *P<0.05 (unpaired Student’s t-test).
Figure 5.
Figure 5.. Whole bone marrow transplantation rescues neurological defects.
(A) Kaplan-Meier survival curve, **: P<0.01 (Mantel–Cox) test. (B) FACS analysis of microglia chimerism in representative mice 5 months post BM transplantation. Vertical dashed line illustrates greater intensity of CD45.2 in KO than WT microglia. (C-D) Clinical scores for WT→KO (C) and KO→KO (D) recipients. (E-G) Bone marrow (E) and microglia chimerism (F,G). Bars represent individual mice. (H-I) Microglia immunophenotype. Cells were gated as in (B). Immunophenotypes of host or donor cells (underlined to left in H) are shown for representative mice (H) or for four mice (symbols with mean and SEM in I). Colored lines in H compare peak intensities of microglia in upper and lower panels to the middle panel. MFI: Mean fluorescence intensity. **: p=0.0011 to 0.0037; ***: p=0.0004; ****: p<0.0001; unpaired t-test with Welch’s correction.
Figure 6.
Figure 6.. Effect of Lrrc33 deficiency on transcriptional phenotype of microglia.
(A) Microarray data on microglia isolated from brains of 3 WT and 3 KO animals at 3 weeks. Genes are shown with at least a 2.8-fold change and a p value adjusted for multiple comparisons <0.05. Scale shows quotient of difference between sample intensity and row minimum intensity over the row range. (B) Comparison to genes identified as differentially regulated between WT and II2-Tgfb1;Tgfb1−/− microglia (Butovsky et al., 2014). Green-orange scale: agree, change in same direction in our dataset with fold change >2.8 and p-value<0.05; trend, change in same direction in our dataset with fold change <2.8; disagree, opposite direction of change in two datasets. Red-blue scale is same as in (A). (C) GSEA of TGF-β signaling in WT microglia. (D) GSEA results showing the most significant Hallmark differences (Subramanian, 2005). ES, enrichment scores.
Figure 7.
Figure 7.. The milieu model.
In vivo evidence summarized in Discussion suggests that TGF-β is activated in separate neuronal-glial and vascular milieus in the CNS, with little or no diffusion of TGF-β between milieus (dotted lines). Furthermore, there is little spreading between microglia of TGF-β activated within the neuronal-glial milieu (dotted lines between microglia).

Comment in

References

    1. Abe M, Harpel JG, Metz CN, Nunes I, Loskutoff DJ, and Rifkin DB (1994). An assay for transforming growth factor-beta using cells transfected with a plasminogen activator inhibitor-1 promoter-luciferase construct. Anal Biochem 216, 276–284. - PubMed
    1. Aluwihare P, Mu Z, Zhao Z, Yu D, Weinreb PH, Horan GS, Violette SM, and Munger JS (2009). Mice that lack activity of αVβ6- and αVβ8-integrins reproduce the abnormalities of TGFβ1- and TGFβ3-null mice. J Cell Sci 122, 227–232. - PMC - PubMed
    1. Aricescu AR, Lu W, and Jones EY (2006). A time- and cost-efficient system for high-level protein production in mammalian cells. Acta Crystallogr D Biol Crystallogr 62, 1243–1250. - PubMed
    1. Barash S, Wang W, and Shi Y (2002). Human secretory signal peptide description by hidden Markov model and generation of a strong artificial signal peptide for secreted protein expression. Biochem Biophys Res Commun 294, 835–842. - PubMed
    1. Bilimoria PM, and Stevens B (2015). Microglia function during brain development: New insights from animal models. Brain Res 1617, 7–17. - PubMed

Publication types

MeSH terms