. 2018 Jul 12;174(2):433-447.e19.
doi: 10.1016/j.cell.2018.05.036. Epub 2018 Jun 18.

Structural Alterations Driving Castration-Resistant Prostate Cancer Revealed by Linked-Read Genome Sequencing

Affiliations

Structural Alterations Driving Castration-Resistant Prostate Cancer Revealed by Linked-Read Genome Sequencing

Srinivas R Viswanathan et al. Cell. .

Abstract

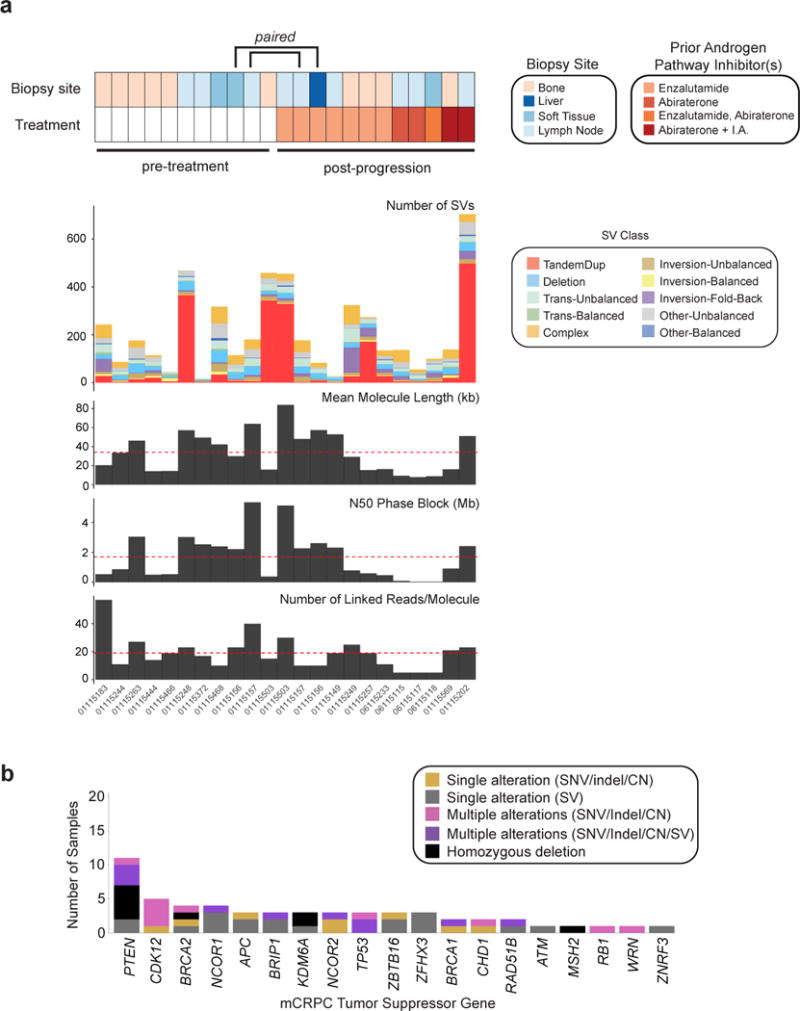
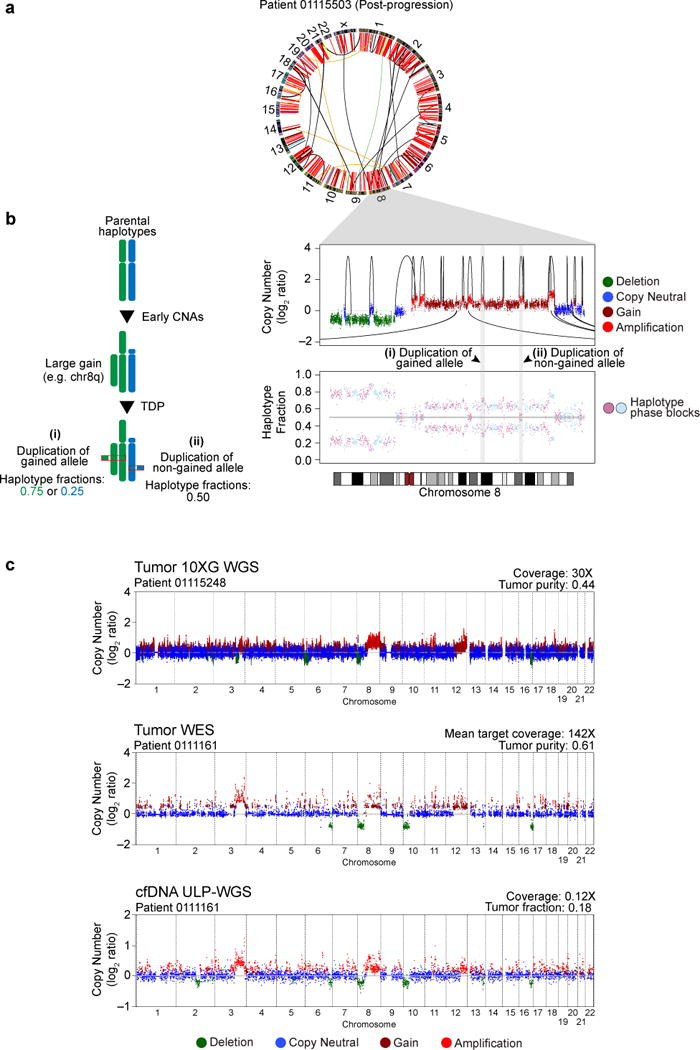
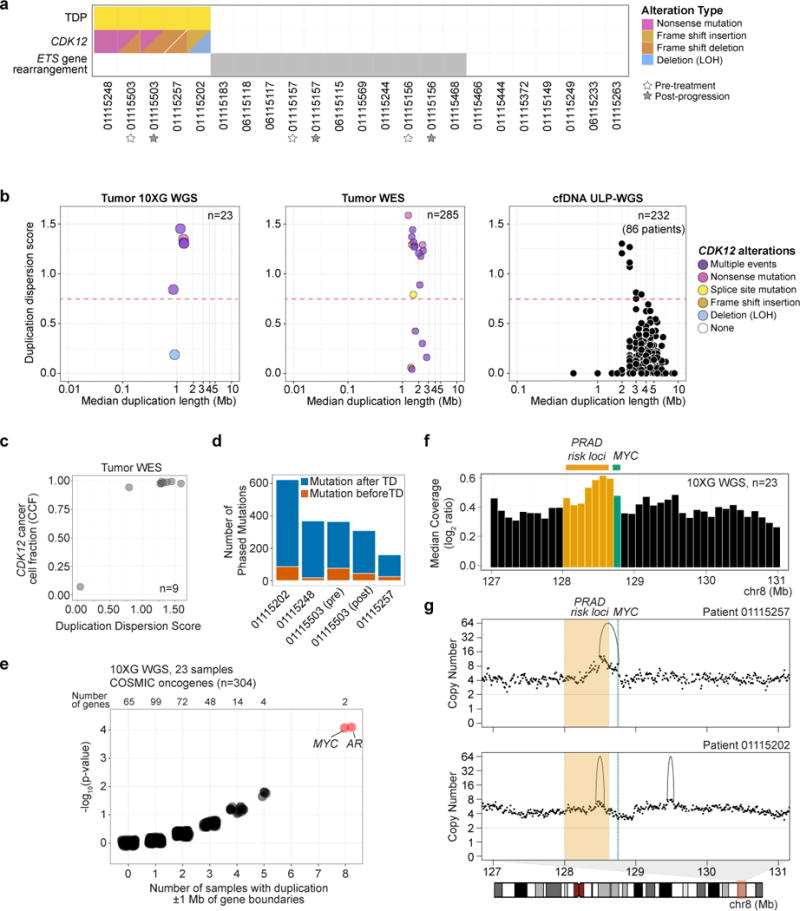
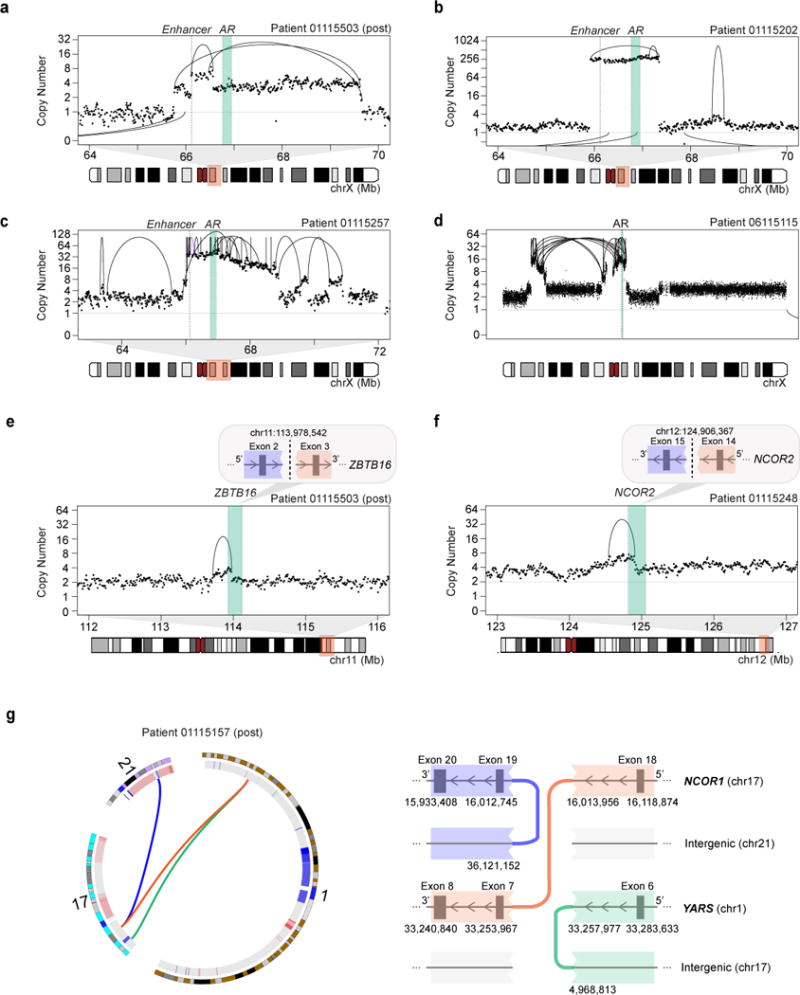
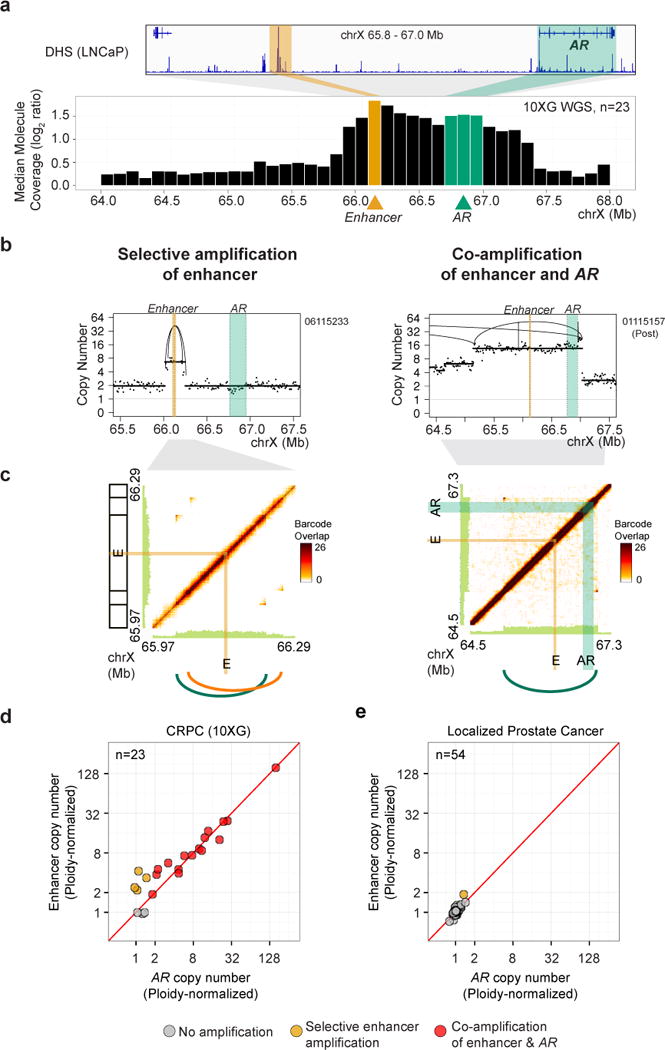
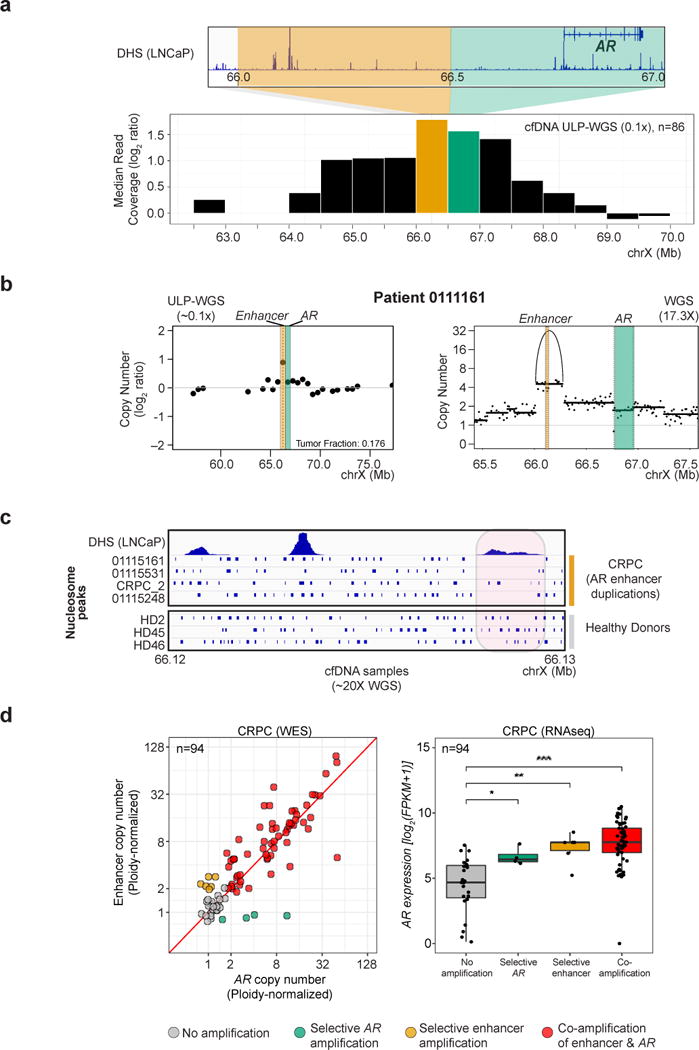
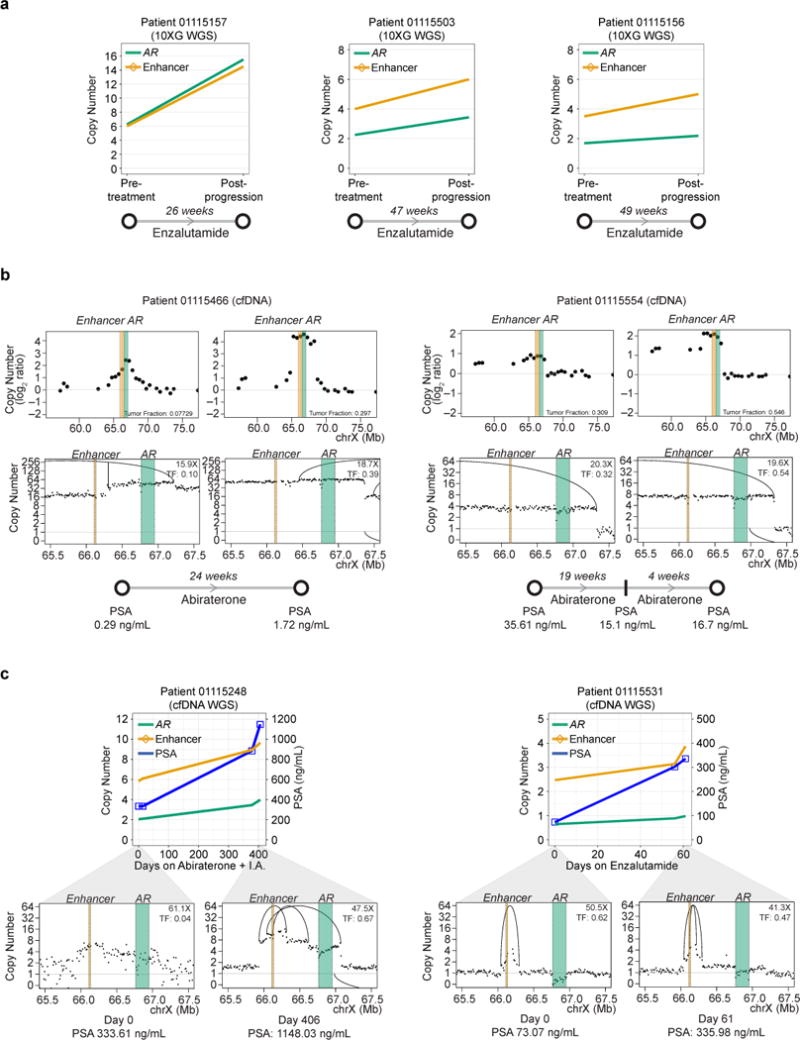
Nearly all prostate cancer deaths are from metastatic castration-resistant prostate cancer (mCRPC), but there have been few whole-genome sequencing (WGS) studies of this disease state. We performed linked-read WGS on 23 mCRPC biopsy specimens and analyzed cell-free DNA sequencing data from 86 patients with mCRPC. In addition to frequent rearrangements affecting known prostate cancer genes, we observed complex rearrangements of the AR locus in most cases. Unexpectedly, these rearrangements include highly recurrent tandem duplications involving an upstream enhancer of AR in 70%-87% of cases compared with <2% of primary prostate cancers. A subset of cases displayed AR or MYC enhancer duplication in the context of a genome-wide tandem duplicator phenotype associated with CDK12 inactivation. Our findings highlight the complex genomic structure of mCRPC, nominate alterations that may inform prostate cancer treatment, and suggest that additional recurrent events in the non-coding mCRPC genome remain to be discovered.

Keywords: CDK12; MYC; androgen receptor; castration-resistant prostate cancer; cell-free DNA; enhancer; linked read whole-genome sequencing; non-coding cancer genome; structural variants; tandem duplicator phenotype.


Conflict of interest statement

Declaration of Interests

G.H., S.S.F., V.A.A.: Patent application WO2017161175A1 (ichorCNA)

C-Z.Z: Co-founder, advisor, and share-holder, Pillar Biosciences

E.M.V: Consultant, Tango Therapeutics, Genome Medical, Invitae; research funding, BMS and Novartis

A.D.C.: Receives research funding from Bayer

G.G.: Receives research funding from Bayer and IBM

M.M.: Scientific advisory board chair and equity holder, OrigiMed; research funding, Bayer; inventor of a patent for EGFR mutation diagnosis in lung cancer, licensed to LabCorp.

Figures

Figure 1
Figure 1. WGS of mCRPC tumors on the 10XG platform
(a) Landscape of rearrangements and sequencing metrics across the 10XG WGS mCRPC cohort. Structural variant classification defined in STAR Methods. I.A., investigational agent. (b) Number of samples containing one or multiple alterations in significantly inactivated mCRPC genes (Robinson et al., 2015). Alterations are classified as being due to SNVs, indels, or copy number loss or due to transecting SV. See also Figures S1–S3 and Tables S1–S5.
Figure 2
Figure 2. A genome-wide TDP in mCRPC
(a) CIRCOS plot for a representative TDP sample profiled by 10XG WGS. Red arcs, tandem duplications. (b) Left: Duplications that occur on one haplotype in the setting of prior chromosome 8q gain lead to predicted haplotype fractions of either 0.75 or 0.25, depending on which allele is duplicated. Right: Chromosome 8 copy number profile (top) and haplotype fraction (bottom, alternating phase blocks colored). Intra-chromosomal tandem duplications shown by arcs on top of data points; inter-chromosomal events shown by arcs below the data points. (c) Genome-wide copy number profiles (log2 ratio) for representative TDP samples profiled by 10XG WGS (top), WES (middle), or ULP-WGS of cfDNA (bottom). See also Figures S1, S2, S4 and Table S6.
Figure 3
Figure 3. The TDP in mCRPC is associated with biallelic and clonal CDK12 inactivation
(a) TDP, CDK12 alteration, and ETS-rearrangement status in 10XG WGS mCRPC cohort. (b) Duplication dispersion score (>0.75 defined as TDP) among mCRPC samples profiled by 10XG WGS (left), WES (middle), or ULP-WGS of cfDNA (right). CDK12 alteration status shown for WGS and WES datasets. (c) Duplication dispersion score and CDK12 cancer cell fraction among CDK12 mutant (SNV) samples profiled by WES. (d) Number of mutations determined to be acquired before or after duplication events in the five TDP samples from the 10XG WGS cohort. (e) Tandem duplications within 1 Mb upstream and downstream of COSMIC oncogene boundaries in the 10XG WGS cohort. For each oncogene, the frequency (X-axis) and the p-value (binomial exact test; Y-axis) are shown with random jitter noise. Red points, Benjamini-Hochberg q-value < 0.05. (f) Median of normalized molecule coverage near MYC. Green, MYC coding sequence. Yellow, region containing some of the prostate cancer 8q24 germline risk variants. Bin size, 100 kB. (g) Purity-adjusted copy number profiles from representative TDP samples with duplications near MYC. Shaded region (chr8, 128.0-128.62Mb) contains tandem duplications in 10XG WGS cohort and overlaps with 8q24 prostate cancer germline risk variants. See also Figures S1, S2, S4 and Table S6.
Figure 4
Figure 4. Diverse structural rearrangements of the AR axis
(a–d) Rearrangements involving the AR locus include: (a) simple and nested duplications, (b) high-level copy number gains, (c) amplification due to breakage-fusion-bridge cycles, and (d) trans-centromeric rearrangements. Copy number shown is purity-adjusted. (e–g) Examples of rearrangements disrupting AR-related genes in mCRPC include duplications transecting (e) ZBTB16 and (f) NCOR2, and (g) a chained chromoplexy event resulting in disruption of the C-terminal domain of NCOR1 and production of an in-frame N-terminal NCOR1-YARS fusion transcript. Inter-chromosomal rearrangements are shown as arcs below the data points. Note: Samples 01115503, 01115202, 01115257, and 01115248 all display the TDP. See also Figure S5 and Table S5.
Figure 5
Figure 5. Highly recurrent tandem duplications involving an enhancer of the AR in mCRPC
(a) Median of normalized molecule coverage near the AR gene and enhancer in the 10XG WGS mCRPC cohort; bins containing the enhancer overlaps with a DHS in LNCaP cells. Bin size, 100 kb. (b) Purity-adjusted copy number profiles from representative samples displaying selective copy number gain involving the AR enhancer (left) and co-amplification of both the AR gene and enhancer (right). Intra-chromosomal rearrangements are shown by arcs. (c) Barcode overlap plots for the samples shown in (b) demonstrating two tandem duplications spanning the AR enhancer (left) or a duplication involving both the AR gene and enhancer (right). Peaks in off-diagonal barcode overlap (dark orange) converge at rearrangement breakpoints. (d) Purity-adjusted copy number (normalized to sample ploidy) at bins containing the AR enhancer (Y-axis) and AR gene body (X-axis) was used to identify samples containing gains of AR and/or AR enhancer in the 10XG WGS mCRPC cohort. (e) Purity-adjusted copy number (normalized to sample ploidy) at bins containing the AR enhancer (Y-axis) and AR gene body (X-axis) in WGS samples from individuals with localized primary prostate cancer (Baca et al., 2013). See also Figures S5–S7 and Table S4–S7.
Figure 6
Figure 6. Gains of the AR enhancer are detectable in ULP-WGS cfDNA and are associated with increased nucleosome spacing and higher AR expression
(a) Median of normalized read coverage near AR gene and enhancer in the ULP-WGS cfDNA mCRPC cohort (maximum tumor fraction per patient used); bin containing the enhancer overlaps with a DHS in LNCaP cells. Bin size, 500 kb. (b) Copy number profile of a representative sample displaying selective gain involving the AR enhancer in cfDNA. For ULP-WGS data (~0.1X coverage, left), each point represents copy number (log2 ratio) within a 500 kb genomic bin; bins containing the AR gene and enhancer are shaded in green and orange, respectively. For deeper WGS data (17.3X coverage, right), the purity-adjusted copy number profile at 10 kb genomic bins is annotated with copy number segments (lines) as well as rearrangements (arcs). (c) Nucleosome position (blue bars) inferred from cfDNA fragmentation pattern in the region of the AR enhancer in 4 patients with selective gain of the AR enhancer region (top) and 3 healthy donors (bottom), using deep WGS (~20X) of cfDNA. (d) (left): Purity-adjusted copy number (normalized to sample ploidy) at bins containing the AR enhancer (Y-axis) and AR gene body (X-axis) in WES samples from individuals with mCRPC (Robinson et al., 2015). Only samples with available paired transcriptome data are shown. (right): AR expression in samples shown at left, as determined from paired transcriptome data. *, p < 0.05; **, p < 0.01; ***, p < 0.0001 by Wilcoxon rank sum test. See also Figure S5–S7 and Table S4–S7.
Figure 7
Figure 7. Rearrangement pressure on the AR locus in the setting of androgen pathway blockade
(a) Purity-adjusted copy number status at the AR gene and enhancer loci in three paired 10XG WGS tumor biopsy samples taken from patients prior to and after progression on enzalutamide. (b) Copy number profiles at AR locus in cfDNA of two patients collected either early on treatment with abiraterone (left panels) or shortly after PSA progression (right panels). Top panels show ULP-WGS log2 ratio copy number profiles (~0.1X coverage). Lower panels show tumor-fraction-adjusted copy number for deep WGS of these samples (15-20X coverage). (c) Top, Tumor-fraction-adjusted copy number in WGS of cfDNA at the AR gene and enhancer loci during treatment with abiraterone (Patient 01115248) or enzalutamide (Patient 01115531). Bottom, Tumor-fraction-adjusted copy number profiles at the first and last time points for each patient. Rearrangements are indicated by arcs. I.A, investigational agent; TF, tumor fraction. See also Figure S5-S7 and Tables S4-S5.

Comment in

  • New genomic drivers identified.
    Bradley CA. Bradley CA. Nat Rev Urol. 2018 Sep;15(9):525. doi: 10.1038/s41585-018-0057-2. Nat Rev Urol. 2018. PMID: 29977054 No abstract available.
  • Sequence of events in prostate cancer.
    Cotter KA, Rubin MA. Cotter KA, et al. Nature. 2018 Aug;560(7720):557-559. doi: 10.1038/d41586-018-06029-5. Nature. 2018. PMID: 30143757 No abstract available.

References

    1. Adalsteinsson VA, Ha G, Freeman SS, Choudhury AD, Stover DG, Parsons HA, Gydush G, Reed SC, Rotem D, Rhoades J, et al. Scalable whole-exome sequencing of cell-free DNA reveals high concordance with metastatic tumors. Nat Commun. 2017;8:1324. - PMC - PubMed
    1. Ahmadiyeh N, Pomerantz MM, Grisanzio C, Herman P, Jia L, Almendro V, He HH, Brown M, Liu XS, Davis M, et al. 8q24 prostate, breast, and colon cancer risk loci show tissue-specific long-range interaction with MYC. Proc Natl Acad Sci U S A. 2010;107:9742–9746. - PMC - PubMed
    1. Antonarakis ES, Lu C, Wang H, Luber B, Nakazawa M, Roeser JC, Chen Y, Mohammad TA, Chen Y, Fedor HL, et al. AR-V7 and Resistance to Enzalutamide and Abiraterone in Prostate Cancer. N Engl J Med. 2014;371:1028–1038. - PMC - PubMed
    1. Armenia J, Wankowicz SAM, Liu D, Gao J, Kundra R, Reznik E, Chatila WK, Chakravarty D, Han GC, Coleman I, et al. The long tail of oncogenic drivers in prostate cancer. Nat Genet. 2018 In Press. - PMC - PubMed
    1. Arora VK, Schenkein E, Murali R, Subudhi SK, Wongvipat J, Balbas MD, Shah N, Cai L, Efstathiou E, Logothetis C, et al. Glucocorticoid receptor confers resistance to antiandrogens by bypassing androgen receptor blockade. Cell. 2013;155:1309–1322. - PMC - PubMed

Publication types

MeSH terms