. 2018 Jun 28;174(1):88-101.e16.
doi: 10.1016/j.cell.2018.05.028. Epub 2018 Jun 14.

Mitophagy in Intestinal Epithelial Cells Triggers Adaptive Immunity during Tumorigenesis

Affiliations

Mitophagy in Intestinal Epithelial Cells Triggers Adaptive Immunity during Tumorigenesis

Paul K Ziegler et al. Cell. .

Abstract

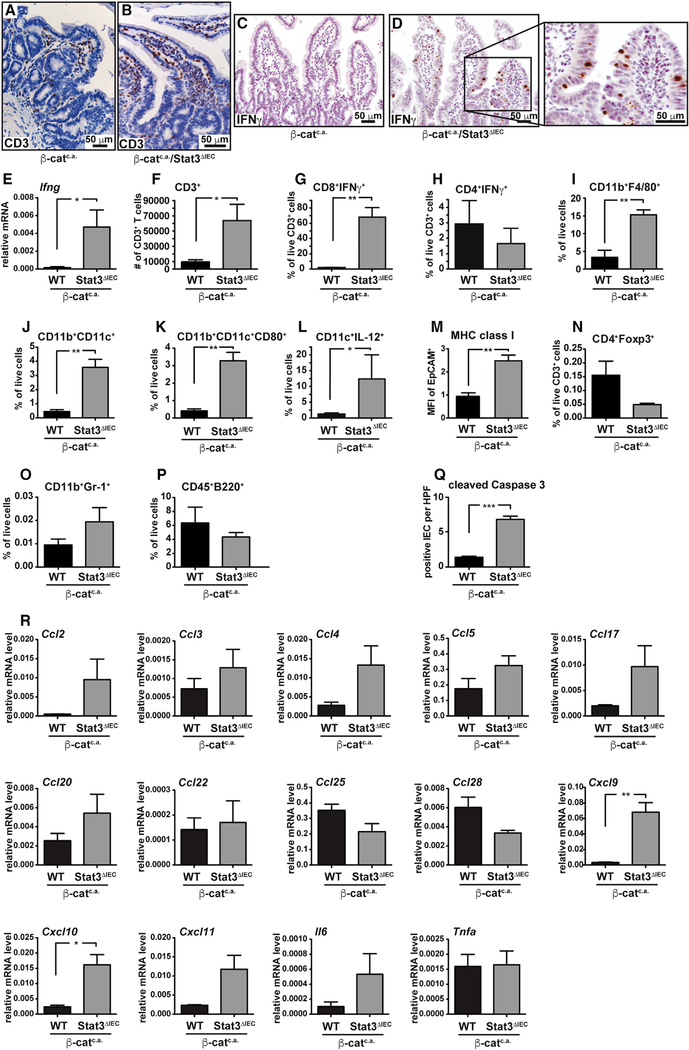
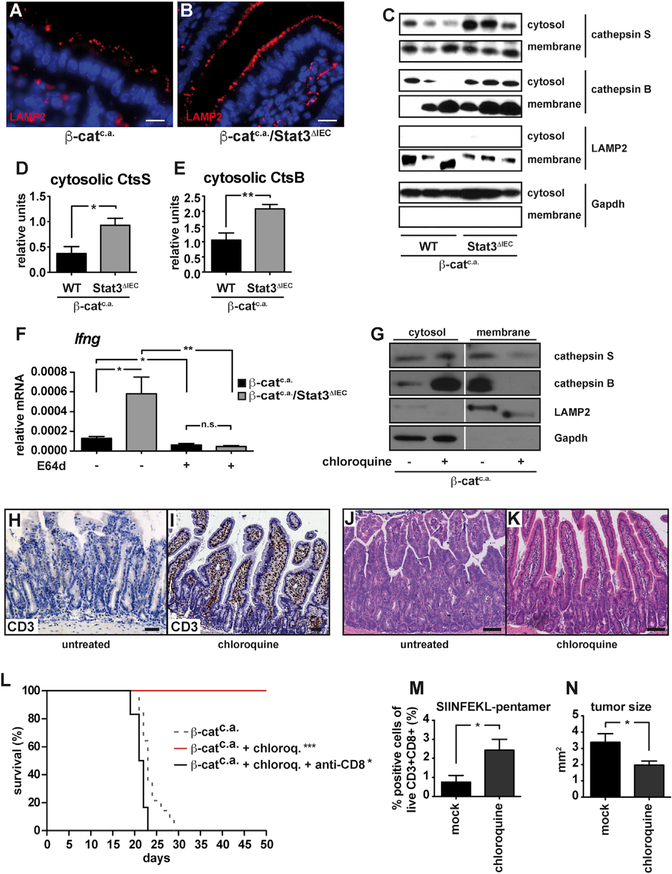
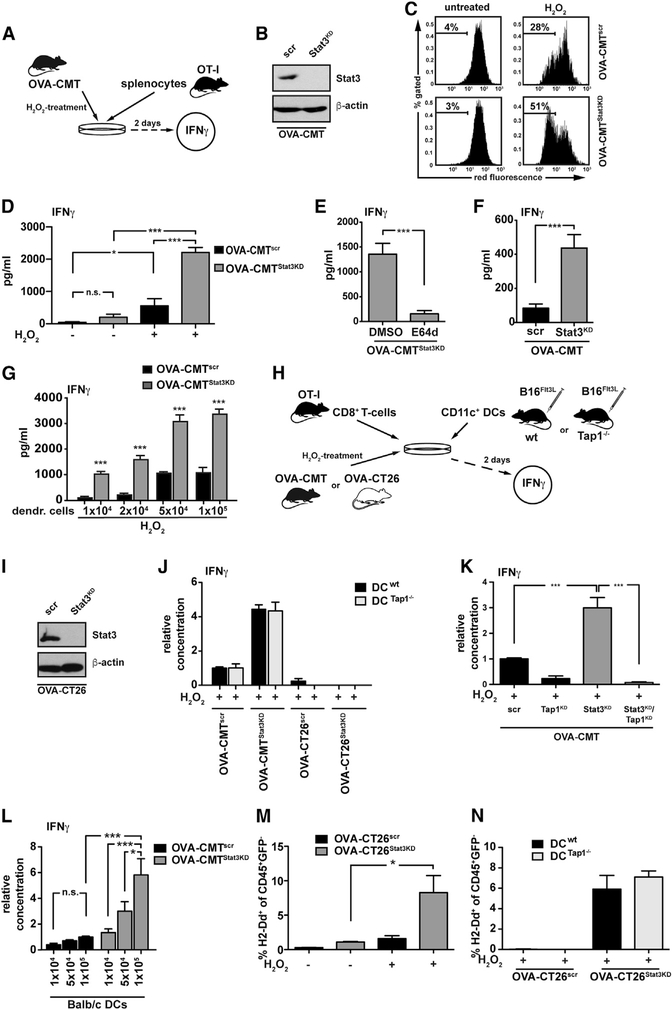
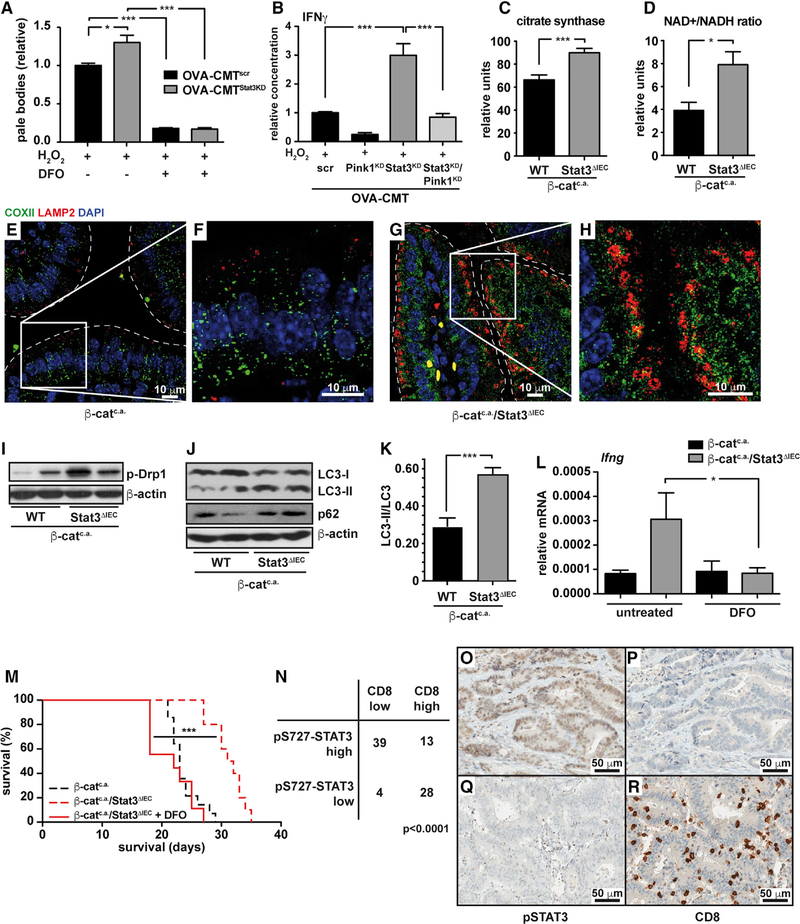
In colorectal cancer patients, a high density of cytotoxic CD8+ T cells in tumors is associated with better prognosis. Using a Stat3 loss-of-function approach in two wnt/β-catenin-dependent autochthonous models of sporadic intestinal tumorigenesis, we unravel a complex intracellular process in intestinal epithelial cells (IECs) that controls the induction of a CD8+ T cell based adaptive immune response. Elevated mitophagy in IECs causes iron(II)-accumulation in epithelial lysosomes, in turn, triggering lysosomal membrane permeabilization. Subsequent release of proteases into the cytoplasm augments MHC class I presentation and activation of CD8+ T cells via cross-dressing of dendritic cells. Thus, our findings highlight a so-far-unrecognized link between mitochondrial function, lysosomal integrity, and MHC class I presentation in IECs and suggest that therapies triggering mitophagy or inducing LMP in IECs may prove successful in shifting the balance toward anti-tumor immunity in colorectal cancer.

Keywords: Stat3; adaptive immunity; antigen processing; colon cancer; cross dressing; intestinal epithelial cells; lysosomal membrane permeabilization; mitophagy.


Conflict of interest statement

DECLARATION OF INTERESTS

The authors declare no competing interests.

Figures

Figure 1.
Figure 1.. Loss of Stat3 in IEC Blocks Initiation of Sporadic Intestinal Tumorigenesis
(A) Tumor incidence in Stat3F/F (n = 10) and Stat3ΔIEC (n = 9) mice 18 weeks after initial AOM challenge. Data are mean ± SEM, **p < 0.01 by one-sample t test. (B–E) Representative H&E-stained sections (B and C) and CD3 immunohistochemistry (IHC) (D and E) of AOM-challenged colons. Scale bars, 1 mm (B and C) and 50 μm (D and E). (F) Quantification of infiltrating CD3+ T cells in colonic non-tumor areas. Data are mean ± SEM, ***p < 0.001 by Student’s t test. (G) Representative H&E-stained colonic aberrant crypt focus from a Stat3ΔIEC mouse 8 weeks after the first AOM injection. Scale bar, 100 μm. (H) Flow cytometric analysis of different myeloid cell subpopulations in colonic lamina propria of Stat3F/F and Stat3ΔIEC mice 1 week after the last AOM injection Data are mean ± SEM; n = 5 per genotype; **p < 0.01 by Student’s t test. (I) Relative mRNA expression 1 week after the last AOM injection. Data are mean ± SEM; n = 5 per genotype. (J–M) IHC of p-Stat3S727 (J and K) and p-Stat3Y705 (L and M) in β-catc.a. mice. Scale bars, 100 μm (J and L) and 50 μm (K and M). (N) Survival of β-catc.a. (n = 15), β-catc.a./Stat3ΔIEC (n = 10) and β-catc.a./Stat3+ mice (n = 11). ***p < 0.001 by log-rank test. See also Figure S1.
Figure 2.
Figure 2.. Stat3ΔIEC Mice Are Characterized by Increased Accumulation of CD8+/IFNγ+ T Cells in the Intestine upon Activation of wnt Signaling
(A–D) IHC of CD3 (A and B) and IFNγ (C and D) 15 days after starting tamoxifen. (E) Relative Ifng mRNA expression in small intestinal mucosa of β-catc.a. and β-catc.a./Stat3ΔIEC mice on day 15; n = 6/genotype. (F) Quantification of infiltrating CD3+ T cells. (G–L) Flow cytometric analysis of IFNγ in CD8+ (G) and CD4+ (H) T cells, CD11b+F4/80+ (I) and CD11b+CD11c+ (J) cells as well as CD80 (K) and IL-12 (L) in CD11c+ cells on day 15; n = 3/genotype. (M) Surface expression (mean fluorescence intensity, MFI) of MHC class I 3 days after first tamoxifen; n = 4/genotype. (N–P) Flow cytometric analysis of CD4+Foxp3+ (N), CD11b+Gr1+ (O), and CD45+B220+ (P) cells on day 15; n = 3/genotype. (Q) Number of cleaved caspase 3-pos. IEC; n = 4/genotype; R 20 high-power fields (HPF)/animal. (R)Relative gene expression of the indicated cytokines or chemokines in IECs on day 15; n = 3/genotype. In (E)–(R), data are mean ± SEM. Scale bars, 50 μm. *p < 0.05, **p < 0.01 by Student’s t test.
Figure 3.
Figure 3.. Suppression of Intestinal Tumor Initiation in Stat3ΔIEC Mice Depends on CD8+/IFNγ+ T Cells
(A–C) Statistical analysis for clonality (A) and diversity of T cell receptor (TCRα and TCRβ) (B and C) in sorted mucosal CD8+ T cells on day 15; n = 3 and 4/genotype, respectively; *p < 0.05 by Mann-Whitney U test. (D and E) Flow cytometric quantification of SIINFEKLMHC pentamer binding CD3+CD8+ T cells (D) in mucosa and surface expression of SIINFEKL-binding MHC class I on IEC (E) on day 15. n = 5 mice/genotype. (F) Flow cytometric quantification of SIINFEKL-MHC pentamer binding CD3+CD8+ T cells in AOM-challenged mice (week 18); n ≥ 4/genotype. (G) Survival of β-catc.a. and β-catc.a./Stat3ΔIEC mice injected with CD8+ T-cell-depleting antibody; n ≥ 5/genotype. (H) Survival of β-catc.a./Stat3ΔIEC mice that had been transplanted with bone marrow (BM) from CD11c-DTR (n = 6) or wild-type (WT) mice (n = 6) 8 weeks before tamoxifen administration and diphteria toxin injection to deplete CD11c+ cells. (I) Survival of β-catc.a./Ifng (n = 9) and β-catc.a./Stat3ΔIEC/Ifng mice (n = 11). *p < 0.05 by Student’s t test (D–F). The dashed gray lines in (A)–(C) represent survival curves of untreated β-catc.a. and β-catc.a./Stat3ΔIEC mice as reproduced from Figure 1N for better comparison. In (A)–(F), data are mean ± SEM. See also Figure S2.
Figure 4.
Figure 4.. Loss of Stat3 in IECs Induces Lysosomal Membrane Permeabilizaton
(A and B) Immunofluorescent LAMP2 staining visualizing lysosomes in the mucosa of β-catc.a. (A) and β-catc.a./Stat3ΔIEC (B) mice on day 3 after first tamoxifen. Scale bar, 10 μm. (C–E) Immunoblot analysis of cathepsin S, cathepsin B, LAMP2, and Gapdh in cytosolic and membrane fractions (C), and densitometric quantification of cytosolic cathepsin S (D) and cytosolic cathepsin B (E) normalized to Gapdh on day 3; Data are mean ± SEM; n ≥ 6/genotype. (F) Ifng-mRNA in β-catc.a. and β-catc.a./Stat3ΔIEC mice treated with E64d on day 15; Data are mean ± SEM; n ≥ 5/genotype. (G) Immunoblot analysis of cathepsin S, cathepsin B, Lamp2, and Gapdh in IECs isolated from untreated or chloroquine-treated (60 mg/kg) β-catc.a. mice on day 3. (H and I) Immunohistochemical analysis of CD3+ T cells in unchallenged (H) and chloroquine-treated (I) β-catc.a. mice on day 15. (J and K) H&E staining of untreated (J) or chloroquine-treated (K) β-catc.a. mice on day 15. (L) Survival of chloroquine-treated (n = 8), chloroquine- and anti-CD8-antibody-treated (n = 6), or untreated β-catc.a. mice (n = 15); *p < 0.05, ***p < 0.001 by log-rank test. The dashed line (for β-catc.a. mice) has been reproduced from Figure 1N for better comparison. (M) SIINFEKL-MHC pentamer binding CD3+CD8+ T cells in OVAIEC mice injected with chloroquine or saline 13 weeks after first AOM injection; Data are mean ± SEM; n = 6/genotype. (N) Mean tumor size in AOM-treated mice that received daily chloroquine (n = 5) or saline (n = 8) intraperitoneally (i.p.) for 4 weeks starting 10 weeks after the last AOM injection. *p < 0.05, **p < 0.01 by Student’s t test. Data are mean ± SEM. See also Figure S3.
Figure 5.
Figure 5.. T Cell Activation by Antigen-Expressing Tumor Cells Is Enhanced by LMP and DC Cross-Dressing In Vitro
For a Figure360 author presentation of Figure 5, see the figure legend at https://10.1016/j.cell.2018.05.028. (A) Experimental setup of co-culture experiment. (B) Immunoblot analysis of STAT3. (C) Representative flow cytometric analysis of acridine-orange-stained OVA-CMTscr and OVA-CMTStat3KD cells. (D) IFNγ released by OT-I splenocytes after co-culture with OVA-CMTscr or OVA-CMTStat3KD cells for 2 days; n = 6 from 2 independent experiments. (E) IFNγ released by OT-I splenocytes that had been co-cultured for 2 days with E64d-pre-treated OVA-CMTStat3KD cells; n = 6 from 2 independent experiments. Note that protease inhibitor was present during H2O2 stimulation but absent during co-culture with OT-I cells. (F) IFNγ released by CD8+ OT-I T cells co-cultured for 2 days with H2O2-pre-treated OVA-CMTscr or OVA-CMTStat3KD cells; n = 6 from 2 independent experiments. (G)IFNγ released by CD8+ OT-I T cells with DCs co-cultured with H2O2-pre-treated OVA-CMTscr or OVA-CMTStat3KD cells; n ≥ 3 from 2 independent experiments. (H) Experimental setup of co-culture experiments. (I) Immunoblot analysis of STAT3. (J) IFNγ released by OT-I T cells co-cultured with WT or Tap1−/− CD11c+ DCs and with H2O2-stimulated OVA-CMT or OVA-CT26 cells; n = 6 from 2 independent experiments. (K) IFNγ released by OT-I splenocytes after co-culture with H2O2-stimulated OVA-CMT cells with knockdown of Tap1 and/or Stat3; n = 6 from 2 independent experiments. ***p < 0.001 by Student’s t test. (L) IFNγ released by CD8+ OT-I T cells co-cultured with OVA-CMTscr or OVA-CMTStat3KD cells and DCs from BALB/c donors as indicated; n = 12 from 4 independent experiments. *p < 0.05, ***p < 0.001 by one-way ANOVA. (M)Quantification of H2-Dd on splenocytes from WT C57BL/6 donor mice co-cultured with OVA-CT26scr or OVA-CT26Stat3KD cells pre-treated as indicated; n = 6 from 2 independent experiments. *p < 0.05 by Student’s t test. (N) Quantification of H2-Dd on splenocytes from WT or Tap1−/− C57BL/6 donor mice co-cultured with H2O2 pretreated OVA-CT26scr or OVA-CT26Stat3KD cells; n = 6 from two independent experiments. *p < 0.05, ***p < 0.001 by Student’s t test (D–G). In (D)–(G) and (J)–(N), data are mean ± SEM. See also Figure S4.
Figure 6.
Figure 6.. Stat3 Deficiency Induces Mitophagy and Increased Lysosomal Iron Load
(A–D) Confocal live cell microscopy of the fluorescent Fe2+-specific probe IP-1 in OVA-CMTscr (A and B) or OVA-CMTStat3KD (C and D) cells. LUT as depicted on the right-hand side. (E–H) Mitophagy in OVA-CMTscr (E and F) and OVA-CMTStat3KD (G and H) was visualized by co-staining for the mitochondrial protein COXII (green) and the lysosomal membrane protein LAMP2 (red). (I and J) Respirometry of intact cells. Basal rate was measured after an initial stabilization time (position a in Figure S5J) (I) and the maximal rate after addition of a saturating amount of FCCP (positions b and c for OVA-CMTscr and OVA-CMTStat3KD, respectively, in Figure S5J) (J); n = 10 from 10 independent experiments. (K) Relative glucose uptake over 12 hr; n = 7 from 2 independent experiments. (L) ATP content as measured by luciferase activity; n = 12 from 4 independent experiments. (M) MFI of cells incubated with MitoTracker; n = 11 from 3 independent experiments. (N) Relative fraction of cells showing low TMRM staining; n = 9 from 3 independent experiments. (O) Ratio of cells showing green or red fluorescence of MitoTimer, indicating new or old mitochondria, respectively; n = 18 from 3 independent experiments. (P) Relative amount of pale bodies in MEFs reconstituted with the indicated variant of Stat3a after treatment with H2O2; n = 7 of 3 independent experiments. *p < 0.05, **p < 0.001 by one-way ANOVA against not-reconstituted Stat3−/− MEFs. *p < 0.05,**p < 0.01, ***p < 0.001 by Student’s t test (J–O). In (I)–(P), data are mean ± SEM. See also Figure S5.
Figure 7.
Figure 7.. Lysosomal Iron Enhances Anti-tumor Immune Reaction In Vivo
(A) Relative fraction of OVA-CMTscr and OVA-CMTStat3KD cells with low red acridine orange fluorescence (pale bodies); n = 4 of two independent experiments. (B) IFNγ released by OT-I splenocytes after co-culture with H2O2 stimulated OVA-CMT cells with knockdown of Pink1 and/or Stat3; n = 6 from 2 independent experiments. (C) Citrate synthase activity in mitochondrial isolates of IECs of β-catc.a. and β-catc.a./Stat3ΔIEC 3 days after the start of tamoxifen. Samples were normalized to total protein content and measured in triplicates of 6 mice each. (D) NAD+/NADH-ratio in β-catc.a. and β-catc.a./Stat3ΔIEC mice on day 3; n ≥ 4/genotype. (E–H) Co-staining for the mitochondrial protein COXII (green) and the lysosomal membrane protein LAMP2 (red) in β-catc.a. (E and F) and β-catc.a./Stat3ΔIEC (G and H) mice on day 3. (I) Immunoblot analysis of phospho-Drp1 protein in lysates of IECs of β-catc.a. and β-catc.a./Stat3ΔIEC mice on day 3. (J and K) Immunoblot analysis of LC3 and p62 (J) and quantification of LC3-II/LC3 conversion ratio (K) in β-catc.a. and β-catc.a./Stat3ΔIEC mice on day 15. (L) Relative Ifng-mRNA in β-catc.a. and β-catc.a./Stat3ΔIEC mice treated with the iron-chelator DFO (400 mg/kg bodyweight) or control; n ≥ 5/genotype. (M) Survival of β-catc.a./Stat3ΔIEC mice (n = 9) treated with DFO. Dashed lines have been reproduced from Figure 1N for better comparison. ***p < 0.001 by log-rank test. (N) Correlation of pS727-STAT3 expression and presence of CD8+ T cells in human colorectal cancer (CRC, N = 84; χ2 test, p < 0.0001). (O–R) Representative immunohistochemical analysis of pS727-STAT3 (O and Q) and CD8 (P and R) in human CRC. Scale bars, 50 μm. See also Figure S6. *p < 0.05, ***p < 0.001 by Student’s t test (A–D). In (A)–(D) and (J)–(L), data are mean ± SEM.

Comment in

References

    1. Accapezzato D, Visco V, Francavilla V, Molette C, Donato T, Paroli M, Mondelli MU, Doria M, Torrisi MR, and Barnaba V (2005). Chloroquine enhances human CD8+ T cell responses against soluble antigens in vivo. J. Exp. Med 202, 817–828. - PMC - PubMed
    1. Akkari L, Gocheva V, Quick ML, Kester JC, Spencer AK, Garfall AL, Bowman RL, and Joyce JA (2016). Combined deletion of cathepsin protease family members reveals compensatory mechanisms in cancer. Genes Dev. 30, 220–232. - PMC - PubMed
    1. Au-Yeung HY, Chan J, Chantarojsiri T, and Chang CJ (2013). Molecular imaging of labile iron(II) pools in living cells with a turn-on fluorescent probe. J. Am. Chem. Soc 135, 15165–15173. - PMC - PubMed
    1. Beers C, Burich A, Kleijmeer MJ, Griffith JM, Wong P, and Rudensky AY (2005). Cathepsin S controls MHC class II-mediated antigen presentation by epithelial cells in vivo. J. Immunol 174, 1205–1212. - PubMed
    1. Bhattacharya N, Yuan R, Prestwood TR, Penny HL, DiMaio MA, Reticker-Flynn NE, Krois CR, Kenkel JA, Pham TD, Carmi Y, et al. (2016). Normalizing microbiota-induced retinoic acid deficiency stimulates protective CD8(+) T cell-mediated immunity in colorectal cancer. Immunity 45, 641–655. - PMC - PubMed

Publication types

MeSH terms