. 2018 Jul 12;174(2):422-432.e13.
doi: 10.1016/j.cell.2018.05.037. Epub 2018 Jun 14.

A Somatically Acquired Enhancer of the Androgen Receptor Is a Noncoding Driver in Advanced Prostate Cancer

Affiliations

A Somatically Acquired Enhancer of the Androgen Receptor Is a Noncoding Driver in Advanced Prostate Cancer

David Y Takeda et al. Cell. .

Abstract

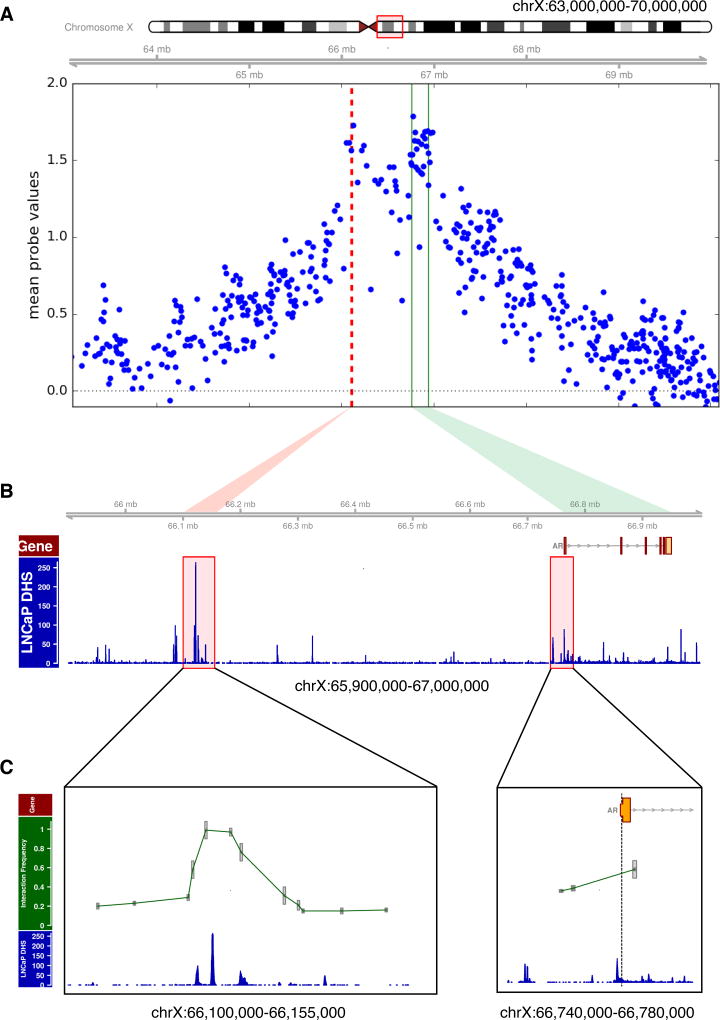
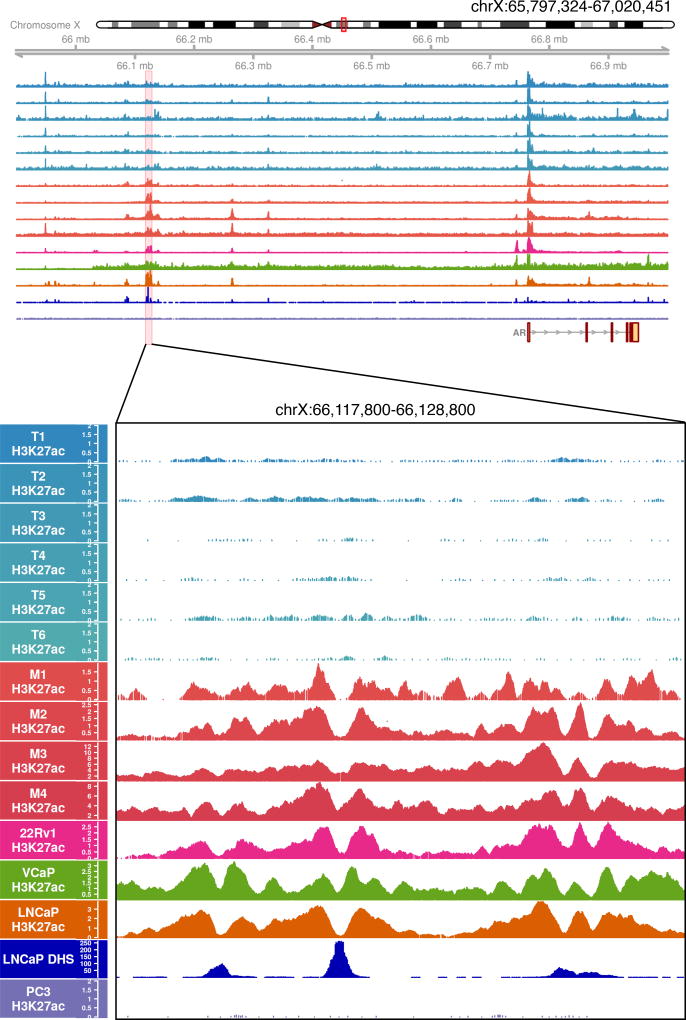
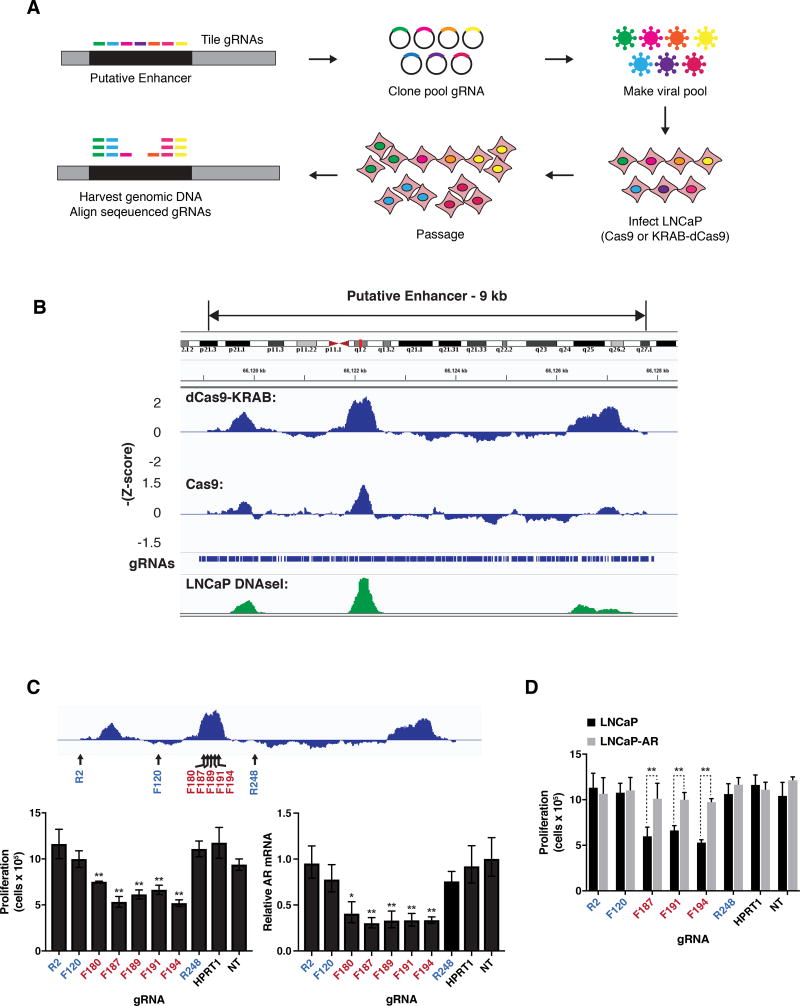
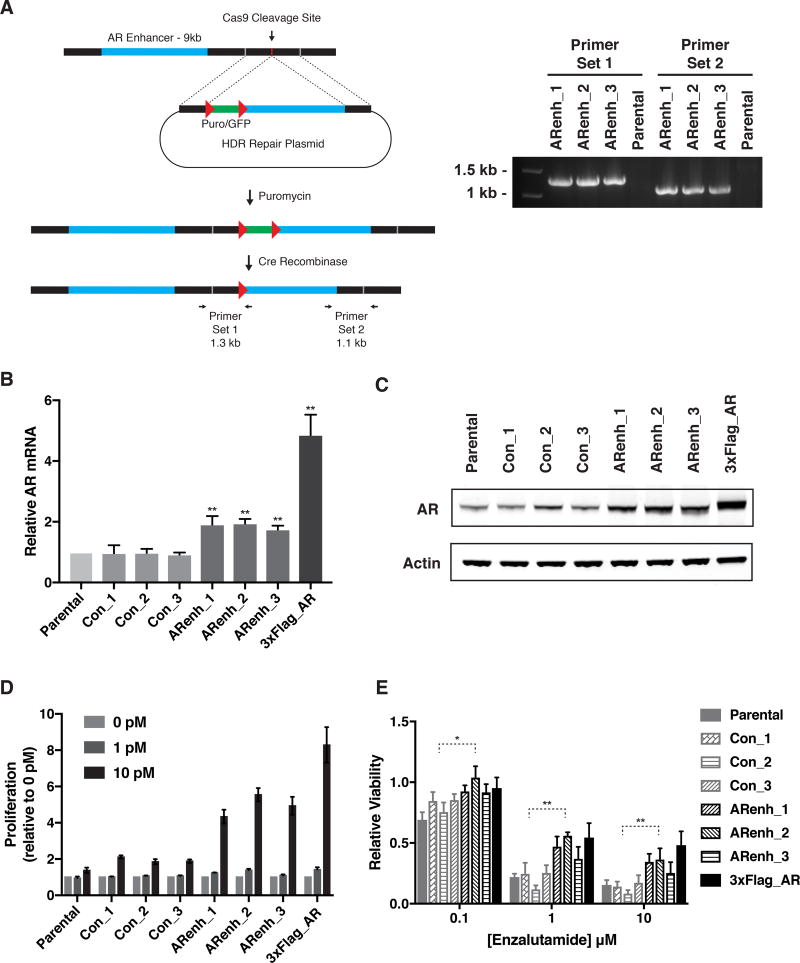
Increased androgen receptor (AR) activity drives therapeutic resistance in advanced prostate cancer. The most common resistance mechanism is amplification of this locus presumably targeting the AR gene. Here, we identify and characterize a somatically acquired AR enhancer located 650 kb centromeric to the AR. Systematic perturbation of this enhancer using genome editing decreased proliferation by suppressing AR levels. Insertion of an additional copy of this region sufficed to increase proliferation under low androgen conditions and to decrease sensitivity to enzalutamide. Epigenetic data generated in localized prostate tumors and benign specimens support the notion that this region is a developmental enhancer. Collectively, these observations underscore the importance of epigenomic profiling in primary specimens and the value of deploying genome editing to functionally characterize noncoding elements. More broadly, this work identifies a therapeutic vulnerability for targeting the AR and emphasizes the importance of regulatory elements as highly recurrent oncogenic drivers.

Keywords: androgen receptor; castrate resistant; enhancer; epigenetic; epigenome editing; epigenomic; functional genomics; genome editing; prostate cancer.


Conflict of interest statement

Declaration of Interests

The authors declare no competing interests.

Figures

Figure 1
Figure 1. A highly recurrent amplicon encompasses an intergenic regulatory element that interacts with the AR gene in CRPC
(A) Cumulative copy number profile as determined from SNP array data from 149 CRPC tumors identify a distinct amplified region (dashed red line) approximately 650 kb centromeric to the AR gene body (demarcated by green lines). (B) DNaseI hypersensitivity data from the LNCaP prostate cancer cell line showing copy number gain overlapping with regions of open chromatin. (C) Chromosome conformation capture (3C) experiment performed in the LNCaP prostate cancer cell line reveals interaction between the candidate regulatory region and the AR promoter. The AR promoter was used as bait (dashed line at AR promoter). Each interaction frequency between the bait and candidate region was measured by quantitative PCR in triplicate. All interactions were normalized to a BAC control spanning this region. Error bars represent the standard error of measurement. See also Figure S1.
Figure 2
Figure 2. The AR candidate enhancer becomes acetylated in metastatic CRPC tumors
Tracks depict H3K27ac as determined by ChIP-seq in tumor samples (n=6 localized tumors; T1–T6 and n=4 metastatic CRPC tumors; M1–M4), AR positive prostate cancer cell lines (22Rv1, VCaP, LNCaP), AR negative prostate cancer cell line (PC3), and DNaseI hypersensitivity in the LNCaP cell line. H3K27ac signal is observed at the AR promoter in all tumor samples (top), but at the enhancer region only in the metastatic CRPC samples. The enhancer region is comprised of three distinct DHS peaks.
Figure 3
Figure 3. The AR enhancer is essential for cell viability in the LNCaP metastatic prostate cancer cell line
(A) Design of pooled CRISPR screens to identify noncoding regions required for proliferation of LNCaP cells. (B) Results of pooled CRISPR screens depicted as sliding window of average –Z-scores of adjacent gRNAs. The positions of the individual gRNAs in the library and LNCaP DNAseI hypersensitivity data from ENCODE are shown. (C) Proliferation of LNCaP cells as measured by cell counting (left) and expression of AR as measured by qRT-PCR (right) after transduction of KRAB-dCas9 and indicated gRNAs. Positions of gRNAs targeting the 9 kb enhancer region are depicted relative to screen results (top). F indicates gRNA designed against the forward strand and R indicates reverse strand. (D) Proliferation of LNCaP cells and LNCaP cells overexpressing exogenous AR (LNCaP-AR) as measured by cell counting after transduction with KRAB-dCas9 and indicated gRNAs. For (C) and (D) transduction of gRNA targeting the unrelated gene HPRT1, and nontargeting gRNA (NT) were used as controls. Expression is normalized to nontargeting gRNA. Data represent the average and standard deviation of 3 biological replicates, and significance determined by Student’s t test. * p = 0.011, ** p< 0.01. See also Figure S2.
Figure 4
Figure 4. AR enhancer knock-in confers a castration resistant state
(A) Genome editing strategy to engineer duplication of AR enhancer. The 9kb enhancer region is inserted approximately 4 kb telomeric to the endogenous enhancer by CRISPR-Cas9 mediated homologous recombination. PCR using indicated primers confirmed correctly positioned enhancer in 3 independent clones (ARenh_1–3). Red triangles indicate LoxP sites. (B) AR expression as measured by qRT-PCR in LNCaP cells with duplication of AR enhancer (ARenh), LNCaP control clones (Con), or LNCaP cells with ectopic overexpression of AR (3xFlag_AR). AR expression was normalized to parental LNCaP cells (Parental). Data represent the average and standard deviation of 3 biological replicates and significance determined by Student’s t test. ** p < 0.01. (C) Protein levels of AR as measured by immunoblotting of cell lysates from LNCaP cells as in (B). Actin is used as a loading control. (D) Proliferation as measured by crystal violet staining of LNCaP cells as described in (B) grown for 7 days in the presence of indicated concentration of R1881. Absorbance was normalized to vehicle control. Data represent the average and standard deviation of 3 biological replicates. (E) Proliferation of LNCaP cells as described in (B) in the presence of indicated concentrations of enzalutamide. Viability was measured by CellTiter-Glo and normalized to vehicle control. Data represent the average and standard deviation of 3 biological replicates and significance determined by Student’s t test. * p < 0.05, ** p< 0.01. See also Figure S3.
Figure 5
Figure 5. The AR enhancer binds transcription factors and resembles a developmental enhancer
(A) Transcription factor binding (FOXA1, HOXB13) and histone modifications (H3K27ac, H3K4me2, H3K27me3) at the AR enhancer locus in localized prostate tumors as determined by ChIP-seq. Representative tracks are shown for the histone modifications. Also shown is DNaseI hypersensitivity data for the LNCaP prostate cancer cell line. The presence of transcription factor binding and the absence of histone modifications suggests that this is a vestigial enhancer that becomes activated during the transition to CRPC. (B) Methylation levels of healthy tissue and tumor prostate samples in the AR enhancer as determined by whole genome bisulfite sequencing analysis. Methylation levels are plotted for the enhancer region (shaded in light purple), along with 4kb upstream and downstream. Locations of the three DHS peaks are shaded in dark purple. Locations of CpGs are denoted with tick marks along the x-axis. No CpGs fall in DHS peak 1. Each point denotes the methylation level for a sample group (Donor, Adjacent Tumor, or Tumor indicated by color). Methylation level for each sample group is computed by dividing the total number of methylated reads by the total coverage for all individuals in that group. Sizes of the points are proportional to total coverage. Smoothed local polynomial regression lines weighted by coverage are plotted for each sample group. See also Figures S4 and S5.

Comment in

References

    1. An integrated encyclopedia of DNA elements in the human genome. Nature. 2012;489:57–74. - PMC - PubMed
    1. Akhtar-Zaidi B, Cowper-Sal-lari R, Corradin O, Saiakhova A, Bartels CF, Balasubramanian D, Myeroff L, Lutterbaugh J, Jarrar A, Kalady MF, et al. Epigenomic enhancer profiling defines a signature of colon cancer. Science (New York, NY) 2012;336:736–739. - PMC - PubMed
    1. Blok LJ, Themmen AP, Peters AH, Trapman J, Baarends WM, Hoogerbrugge JW, Grootegoed JA. Transcriptional regulation of androgen receptor gene expression in Sertoli cells and other cell types. Molecular and cellular endocrinology. 1992;88:153–164. - PubMed
    1. Cai C, He HH, Chen S, Coleman I, Wang H, Fang Z, Chen S, Nelson PS, Liu XS, Brown M, et al. Androgen receptor gene expression in prostate cancer is directly suppressed by the androgen receptor through recruitment of lysine-specific demethylase 1. Cancer cell. 2011;20:457–471. - PMC - PubMed
    1. Chen CD, Welsbie DS, Tran C, Baek SH, Chen R, Vessella R, Rosenfeld MG, Sawyers CL. Molecular determinants of resistance to antiandrogen therapy. Nature medicine. 2004;10:33–39. - PubMed

Publication types

MeSH terms