

Belimumab in kidney transplantation: an experimental medicine, randomised, placebo-controlled phase 2 trial
- PMID: 29910042
- PMCID: PMC7617033
- DOI: 10.1016/S0140-6736(18)30984-X
Belimumab in kidney transplantation: an experimental medicine, randomised, placebo-controlled phase 2 trial
Abstract
Background: B cells produce alloantibodies and activate alloreactive T cells, negatively affecting kidney transplant survival. By contrast, regulatory B cells are associated with transplant tolerance. Immunotherapies are needed that inhibit B-cell effector function, including antibody secretion, while sparing regulators and minimising infection risk. B lymphocyte stimulator (BLyS) is a cytokine that promotes B-cell activation and has not previously been targeted in kidney transplant recipients. We aimed to determine the safety and activity of an anti-BLyS antibody, belimumab, in addition to standard-of-care immunosuppression in adult kidney transplant recipients. We used an experimental medicine study design with multiple secondary and exploratory endpoints to gain further insight into the effect of belimumab on the generation of de-novo IgG and on the regulatory B-cell compartment.
Methods: We undertook a double-blind, randomised, placebo-controlled phase 2 trial of belimumab, in addition to standard-of-care immunosuppression (basiliximab, mycophenolate mofetil, tacrolimus, and prednisolone) at two centres, Addenbrooke's Hospital, Cambridge, UK, and Guy's and St Thomas' Hospital, London, UK. Participants were eligible if they were aged 18-75 years and receiving a kidney transplant and were planned to receive standard-of-care immunosuppression. Participants were randomly assigned (1:1) to receive either intravenous belimumab 10 mg per kg bodyweight or placebo, given at day 0, 14, and 28, and then every 4 weeks for a total of seven infusions. The co-primary endpoints were safety and change in the concentration of naive B cells from baseline to week 24, both of which were analysed in all patients who received a transplant and at least one dose of drug or placebo (the modified intention-to-treat [mITT] population). This trial has been completed and is registered with ClinicalTrials.gov, NCT01536379, and EudraCT, 2011-006215-56.
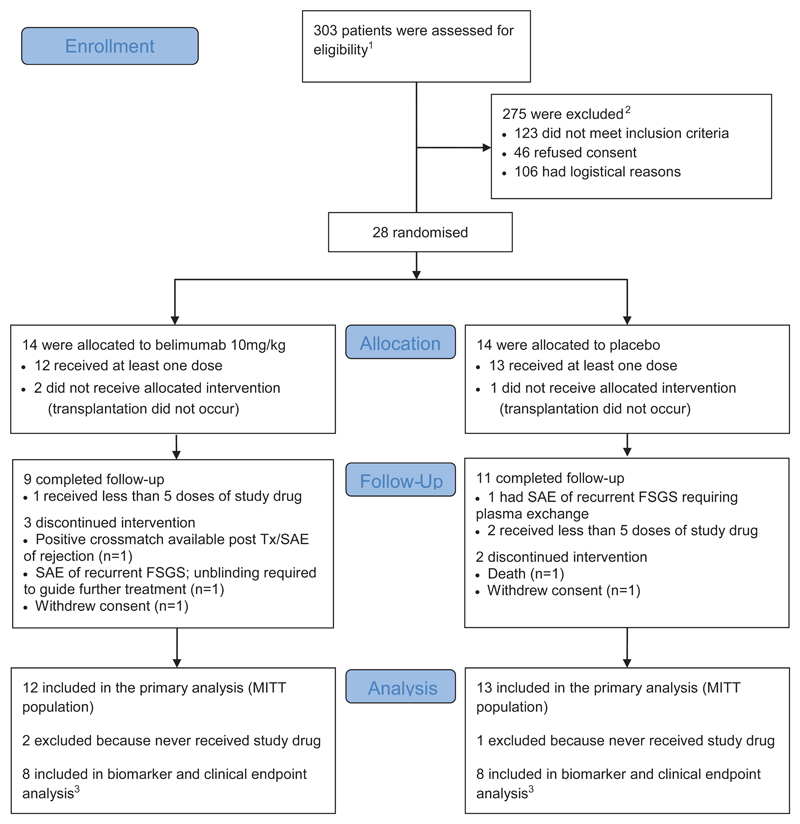
Findings: Between Sept 13, 2013, and Feb 8, 2015, of 303 patients assessed for eligibility, 28 kidney transplant recipients were randomly assigned to receive belimumab (n=14) or placebo (n=14). 25 patients (12 [86%] patients assigned to the belimumab group and 13 [93%] patients assigned to the placebo group) received a transplant and were included in the mITT population. We observed similar proportions of adverse events in the belimumab and placebo groups, including serious infections (one [8%] of 12 in the belimumab group and five [38%] of 13 in the placebo group during the 6-month on-treatment phase; and none in the belimumab group and two [15%] in the placebo group during the 6-month follow-up). In the on-treatment phase, one patient in the placebo group died because of fatal myocardial infarction and acute cardiac failure. The co-primary endpoint of a reduction in naive B cells from baseline to week 24 was not met. Treatment with belimumab did not significantly reduce the number of naive B cells from baseline to week 24 (adjusted mean difference between the belimumab and placebo treatment groups -34·4 cells per μL, 95% CI -109·5 to 40·7).
Interpretation: Belimumab might be a useful adjunct to standard-of-care immunosuppression in renal transplantation, with no major increased risk of infection and potential beneficial effects on humoral alloimmunity.
Funding: GlaxoSmithKline.
Copyright © 2018 Elsevier Ltd. All rights reserved.
Conflict of interest statement
GDB was funded by a Wellcome Trust Translational Medicine and Therapeutics (TMAT) PhD grant (102728/z/13/z). SMF received funding from GlaxoSmithKline (GSK) for a GSK-Wellcome Trust TMAT PhD. SMF, DNS, AG, KEF, AR, L-PE, COS, and RBH are employees of and hold stock in GSK. JAC is employed by a recruitment agency, working on contract at GSK. RBJ did a secondment to GSK, funded by the company. LRD is a previous employee and a stockholder of GSK, and employee and stockholder of Celgene Corporation. GDB, PAL, and MRC have received grants from GSK outside the submitted work. NT has received support to attend clinical meetings from Astellas Pharma and Alexion Pharmaceuticals.
CJEW has received support to attend clinical meetings from Organ Assist and reports consultancy fees from GSK. KGCS reports consultancy fees from MedImmune, UCB, and Kymab. MRC is funded by a Medical Research Council New Investigator Research Grant (MR/N024907/1) and an Arthritis Research UK Cure Challenge Research Grant (21777), and also receives support from the National Institute of Health Research Cambridge Biomedical Research Centre. RBH has a patent PB65956 pending. AR has a patent issued for recombinant factor H and variants and conjugates thereof (US20150139975 A1), and an EU application pending (WO2011077102 A1). AR's spouse David Kavanagh is head of the National Renal Complement Therapeutics Centre, UK; Chief Investigator for NCT02949128, Alexion Pharmaceuticals; founding board member and scientific adviser to Gyroscope Therapeutics (stock options; consultancy fees paid to Newcastle University, Newcastle, UK); and consults for Alexion Pharmaceuticals and Akari Therapeutics (Newcastle University, Newcastle, UK, receives consulting fees). A-MO declares no competing interests.
Figures
Comment in
-
Immunological investigations empower transplant drug trials.Lancet. 2018 Jun 30;391(10140):2578-2579. doi: 10.1016/S0140-6736(18)31081-X. Epub 2018 Jun 14. Lancet. 2018. PMID: 29910041 No abstract available.
-
Belimumab in kidney transplantation.Lancet. 2019 Mar 2;393(10174):874. doi: 10.1016/S0140-6736(18)33074-5. Lancet. 2019. PMID: 30837143 No abstract available.
-
Belimumab in kidney transplantation.Lancet. 2019 Mar 2;393(10174):874-875. doi: 10.1016/S0140-6736(18)33075-7. Lancet. 2019. PMID: 30837144 No abstract available.
References
-
- Lefaucheur C, Loupy A, Vernerey D, et al. Antibody-mediated vascular rejection of kidney allografts: a population-based study. Lancet. 2013;381(9863):313–9. - PubMed
-
- Dragun D, Muller DN, Brasen JH, et al. Angiotensin II type 1-receptor activating antibodies in renal-allograft rejection. N Engl J Med. 2005;352(6):558–69. - PubMed
-
- Sigdel TK, Li L, Tran TQ, et al. Non-HLA antibodies to immunogenic epitopes predict the evolution of chronic renal allograft injury. J Am Soc Nephrol. 2012;23(4):750–63. - PubMed
-
- Bentall A, Cornell LD, Gloor JM, et al. Five-year outcomes in living donor kidney transplants with a positive crossmatch. Am J Transplant. 2013;13(1):76–85. - PubMed
-
- Sarwal M, Chua MS, Kambham N, et al. Molecular heterogeneity in acute renal allograft rejection identified by DNA microarray profiling. N Engl J Med. 2003;349(2):125–38. - PubMed
Publication types
MeSH terms
Substances
Associated data
Grants and funding
LinkOut - more resources
Full Text Sources
Other Literature Sources
Medical
Miscellaneous
