

The Age in Swimming of Champions in World Championships (1994⁻2013) and Olympic Games (1992⁻2012): A Cross-Sectional Data Analysis
- PMID: 29910265
- PMCID: PMC5968937
- DOI: 10.3390/sports4010017
The Age in Swimming of Champions in World Championships (1994⁻2013) and Olympic Games (1992⁻2012): A Cross-Sectional Data Analysis
Abstract
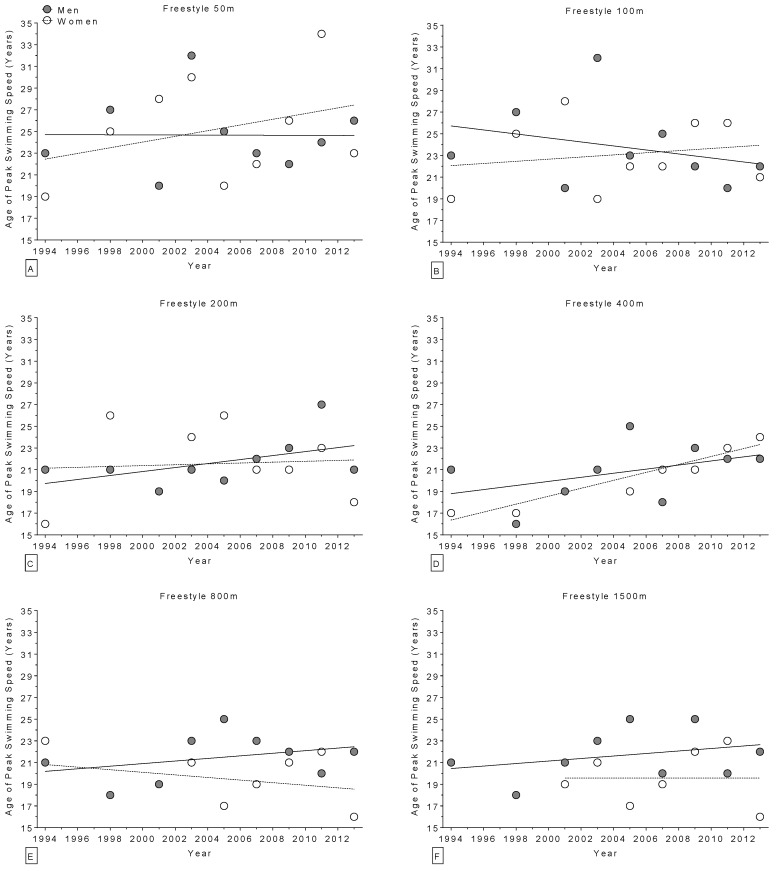
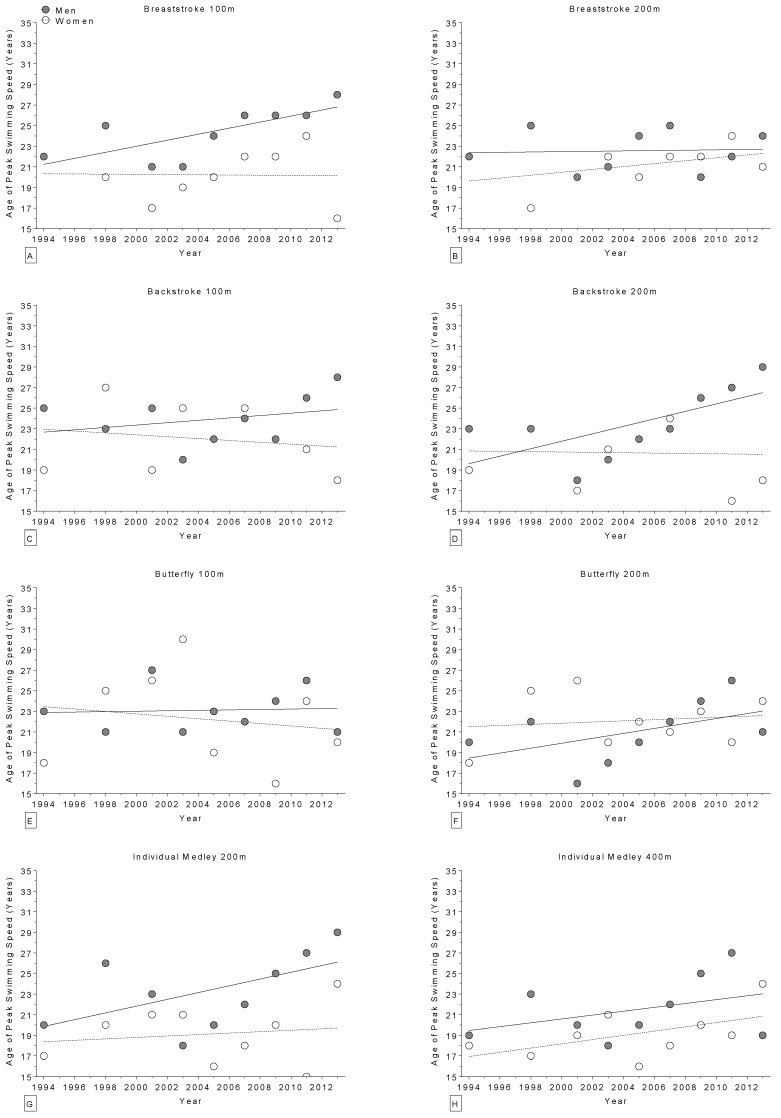
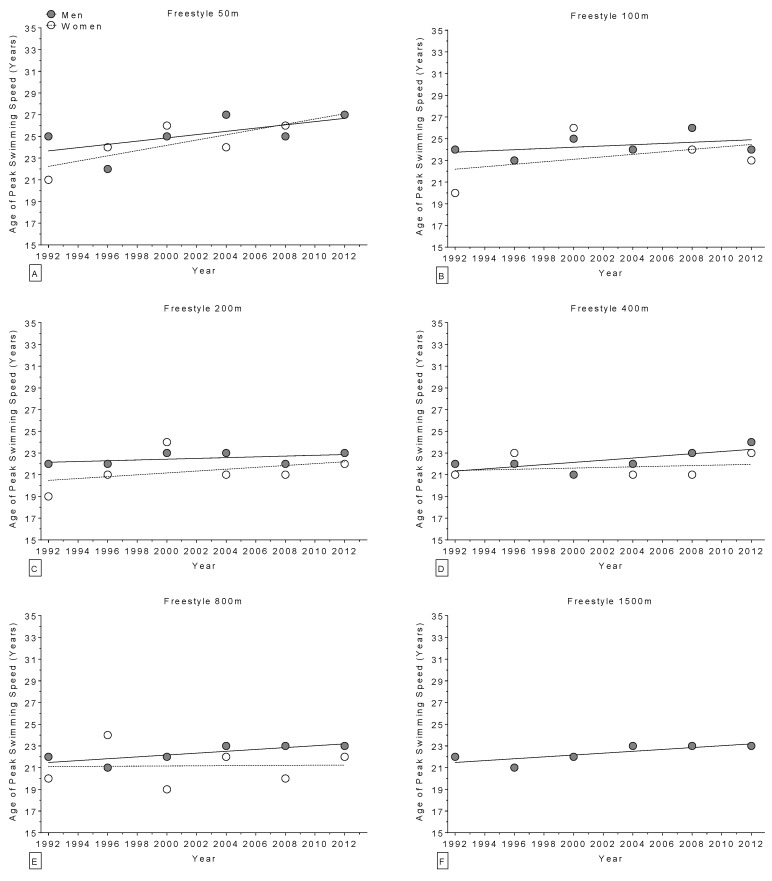
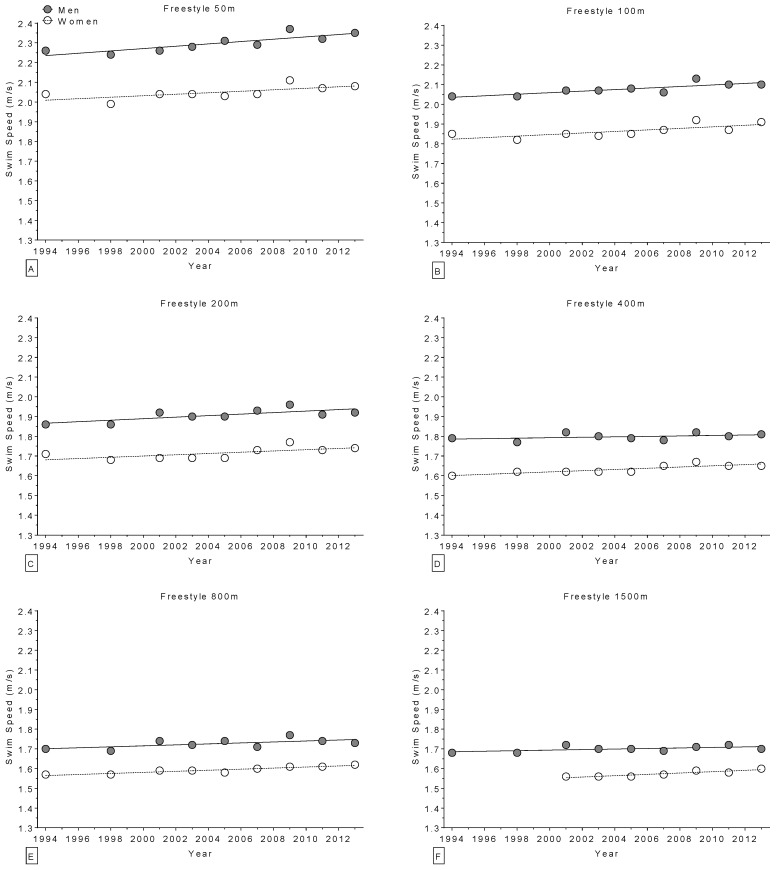
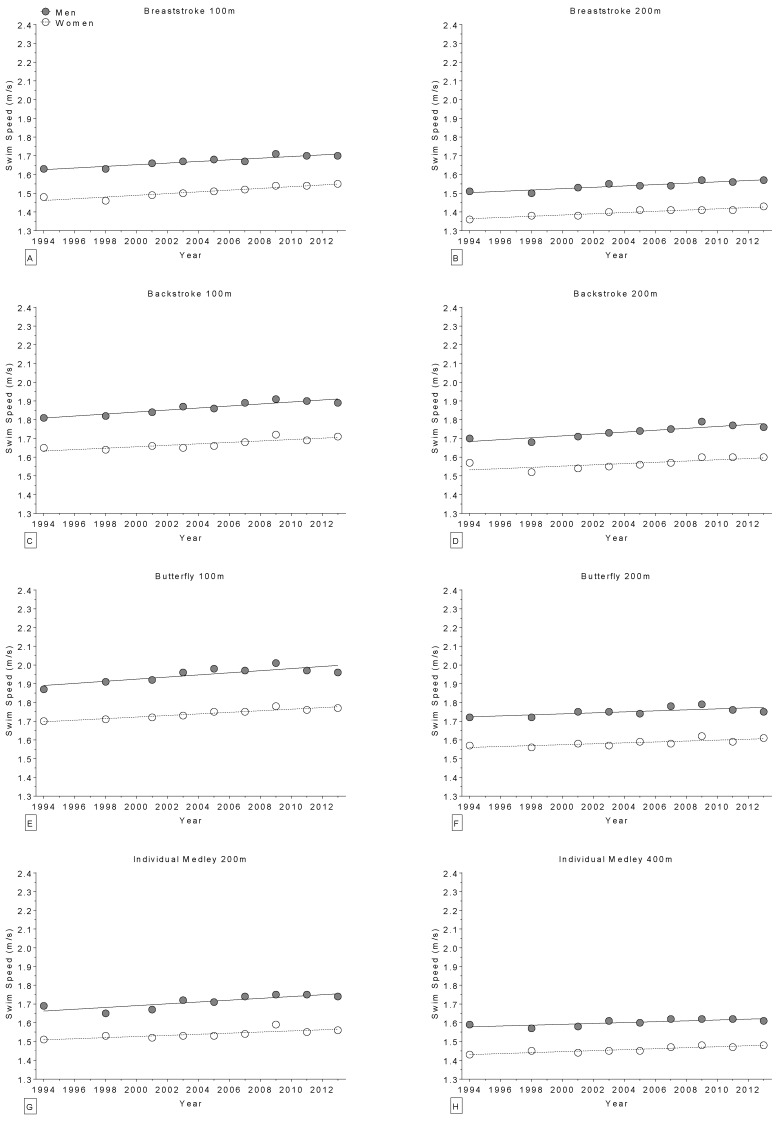
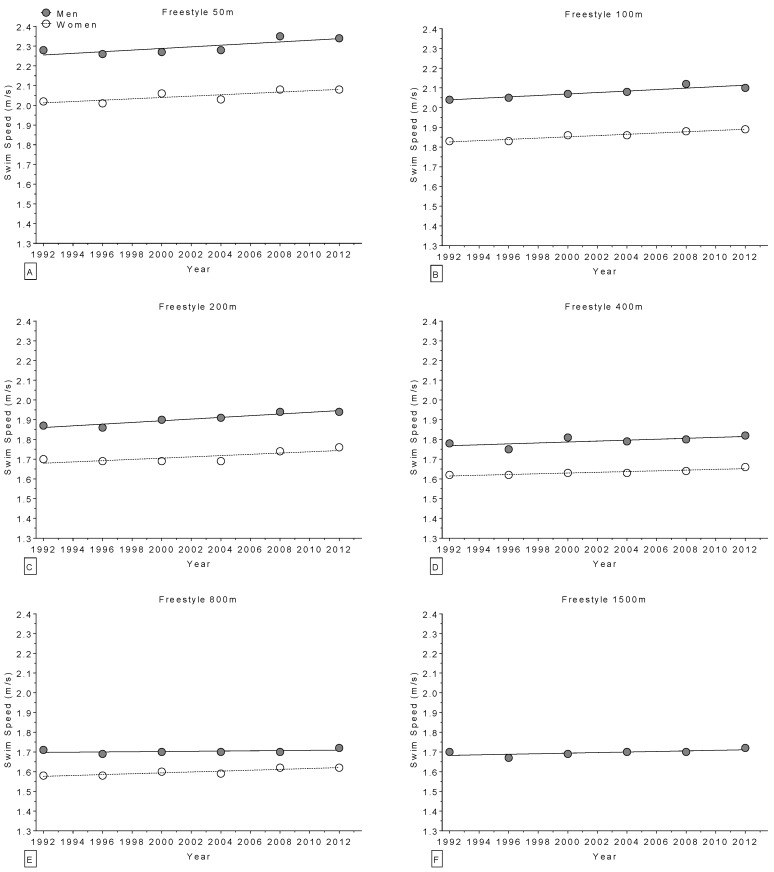
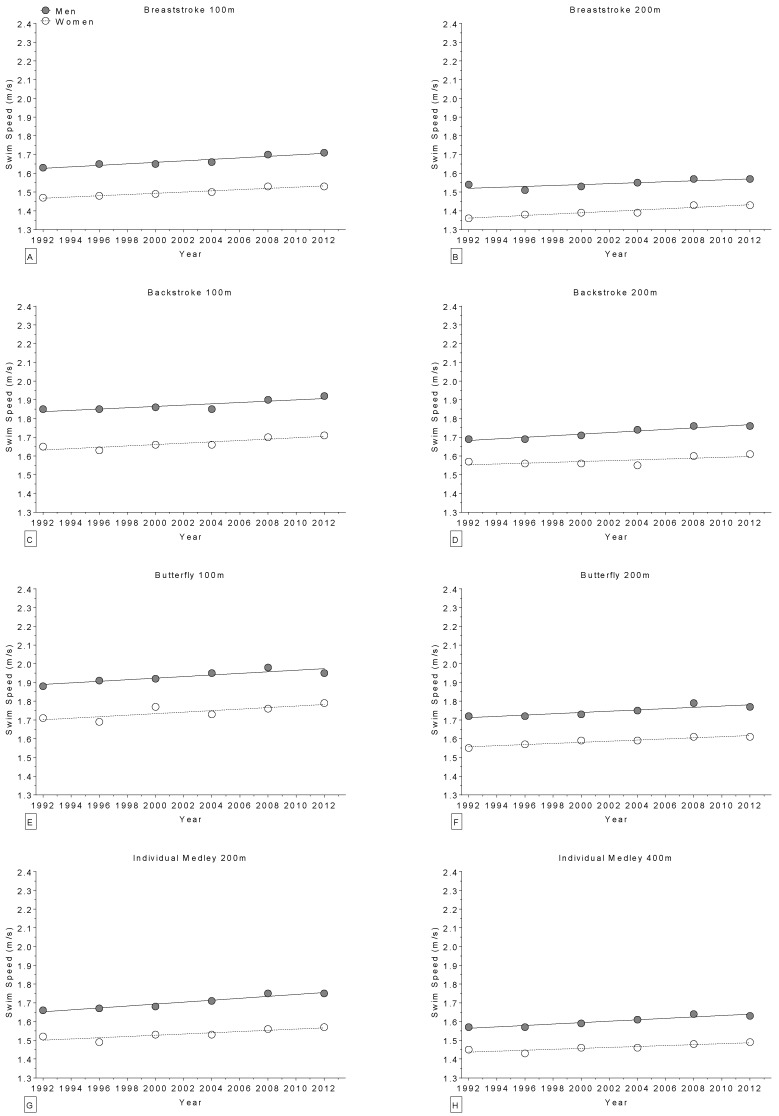
(1) Background: We investigated the age of swimming champions in all strokes and race distances in World Championships (1994⁻2013) and Olympic Games (1992⁻2012); (2) Methods: Changes in age and swimming performance across calendar years for 412 Olympic and world champions were analysed using linear, non-linear, multi-level regression analyses and MultiLayer Perceptron (MLP); (3) Results: The age of peak swimming performance remained stable in most of all race distances for world champions and in all race distances for Olympic champions. Longer (i.e., 200 m and more) race distances were completed by younger (-20 years old for women and -22 years old for men) champions than shorter (i.e., 50 m and 100 m) race distances (-22 years old for women and -24 years old for men). There was a sex difference in the age of champions of -2 years with a mean age of -21 and -23 years for women and men, respectively. Swimming performance improved in most race distances for world and Olympic champions with a larger trend of increase in Olympic champions; (4) Conclusion: Swimmers at younger ages (<20 years) may benefit from training and competing in longer race distances (i.e., 200 m and longer) before they change to shorter distances (i.e., 50 m and 100 m) when they become older (>22 years).
Keywords: age; champions; performance; sex difference.
Conflict of interest statement
The authors declare no conflict of interest.
Figures


Similar articles
-
Changes in sex difference in swimming speed in finalists at FINA World Championships and the Olympic Games from 1992 to 2013.BMC Sports Sci Med Rehabil. 2014 Jun 25;6:25. doi: 10.1186/2052-1847-6-25. eCollection 2014. BMC Sports Sci Med Rehabil. 2014. PMID: 25120914 Free PMC article.
-
Change of the age and performance of swimmers across World Championships and Olympic Games finals from 1992 to 2013 - a cross-sectional data analysis.Springerplus. 2014 Nov 4;3:652. doi: 10.1186/2193-1801-3-652. eCollection 2014. Springerplus. 2014. PMID: 25485195 Free PMC article.
-
Sex difference in age and performance in elite Swiss freestyle swimmers competing from 50 m to 1,500 m.Springerplus. 2014 May 6;3:228. doi: 10.1186/2193-1801-3-228. eCollection 2014. Springerplus. 2014. PMID: 24834376 Free PMC article.
-
Sex Differences in Swimming Disciplines-Can Women Outperform Men in Swimming?Int J Environ Res Public Health. 2020 May 22;17(10):3651. doi: 10.3390/ijerph17103651. Int J Environ Res Public Health. 2020. PMID: 32456109 Free PMC article. Review.
-
The relative power output and relative lean body mass of World and Olympic male and female champions with implications for gender equity.J Sports Sci. 2006 Dec;24(12):1329-39. doi: 10.1080/02640410500520559. J Sports Sci. 2006. PMID: 17101535 Review.
Cited by
-
Performance Increases in Pair Skating and Ice Dance at International Championships and Olympic Games.Int J Environ Res Public Health. 2022 Sep 19;19(18):11806. doi: 10.3390/ijerph191811806. Int J Environ Res Public Health. 2022. PMID: 36142074 Free PMC article.
-
Elite Badminton Is Getting Older: Ages of the Top 100 Ranked Badminton Players from 1994 to 2020.Int J Environ Res Public Health. 2021 Nov 10;18(22):11779. doi: 10.3390/ijerph182211779. Int J Environ Res Public Health. 2021. PMID: 34831537 Free PMC article.
-
Involvement in Multiple Race Events Among International Para and Non-disabled Swimmers.Front Sports Act Living. 2021 Jan 28;2:608777. doi: 10.3389/fspor.2020.608777. eCollection 2020. Front Sports Act Living. 2021. PMID: 33585812 Free PMC article.
-
Analysis of the fastest backstroke age group swimmers competing in the World Masters Championships 1986-2024.Sci Rep. 2024 Jul 26;14(1):17214. doi: 10.1038/s41598-024-68222-z. Sci Rep. 2024. PMID: 39060396 Free PMC article.
References
LinkOut - more resources
Full Text Sources
Other Literature Sources
