

Seasonal Variation of Agility, Speed and Endurance Performance in Young Elite Soccer Players
- PMID: 29910372
- PMCID: PMC5969008
- DOI: 10.3390/sports5010012
Seasonal Variation of Agility, Speed and Endurance Performance in Young Elite Soccer Players
Abstract
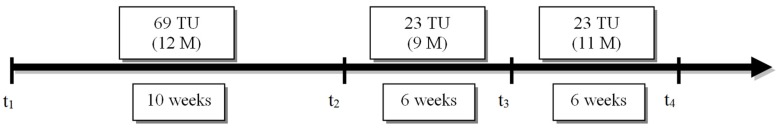
The aim of this study was to investigate changes in the linear running speed (LRS) for 30 m, change of direction speed (CODS), and endurance in young elite Czech soccer players. The following tests were conducted to assess CODS and endurance: Agility 505 turning toward the dominant (A505DL) and non-dominant lower limb (A505NL); Illinois Agility Test (IAT); and intermittent test (Yo-Yo IRT1). During the soccer season, we investigated performance at the following time periods: the start (t₁) and the end of the pre-season period (t₂); during (t₃) and at the end of the competitive period (t₄). Repeated measurement analysis of variance revealed a significant effect of time period on selected fitness parameters (p < 0.05). Post hoc analysis for test A505DL revealed significant improvements of performance at t₃ (2.71 ± 0.08 s) and t₄ (2.72 ± 0.06 s) compared to t₁ (2.81 ± 0.09 s). A505NL was significantly different between t₁ (2.83 ± 0.09 s) and t₂ (2.76 ± 0.09 s), t₃ (2.7 ± 0.07 s) and t₄ (2.71 ± 0.09 s). Performance of CODS at t₁ for the IAT (18.82 ± 0.56 s) was significantly lower (p < 0.05) than any other time period (t₂ = 18.52 ± 0.63 s, t₃ = 17.94 ± 0.51 s, t₄ = 17.89 ± 0.66 s). The power of LRS was significantly different at t₃ (4.99 ± 0.15 s), and t₄ (4.98 ± 0.17 s) compared to t₁ (5.15 ± 0.21 s), and t₂ (5.07 ± 0.14 s). For the Yo-Yo IRT1 test, we observed a significant increase in performance between t₁ (625.26 ± 170.34 m), t₂ (858.95 ± 210.55 m), and t₃ (953.68 ± 229.88 m). These results show the impact of soccer season time period on young soccer player performance and may further serve as a basis for comparison with similar research conducted by peers. These results may aid sports practice for clinicians, conditioning coaches, soccer coaches and physiotherapeutic coaches.
Keywords: football; motor skills; soccer performance; talent identification; training and testing.
Conflict of interest statement
The authors declare no conflict of interest.
Figures
References
LinkOut - more resources
Full Text Sources
Other Literature Sources
