. 2018 Jun 1:9:1207.
doi: 10.3389/fimmu.2018.01207. eCollection 2018.

Adaptive Regulation of Osteopontin Production by Dendritic Cells Through the Bidirectional Interaction With Mesenchymal Stromal Cells

Affiliations

Adaptive Regulation of Osteopontin Production by Dendritic Cells Through the Bidirectional Interaction With Mesenchymal Stromal Cells

Sara Scutera et al. Front Immunol. .

Abstract

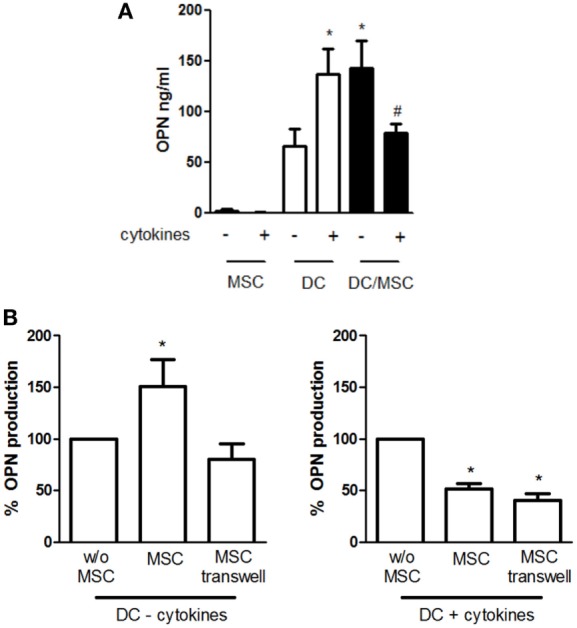
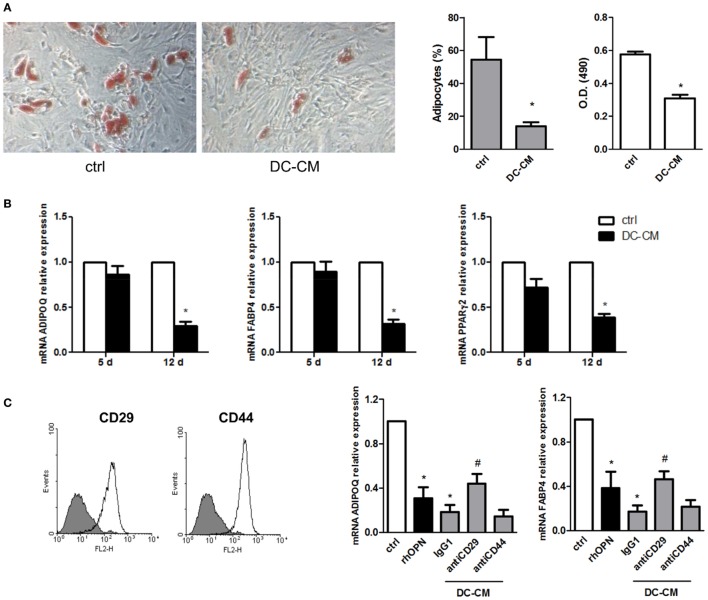
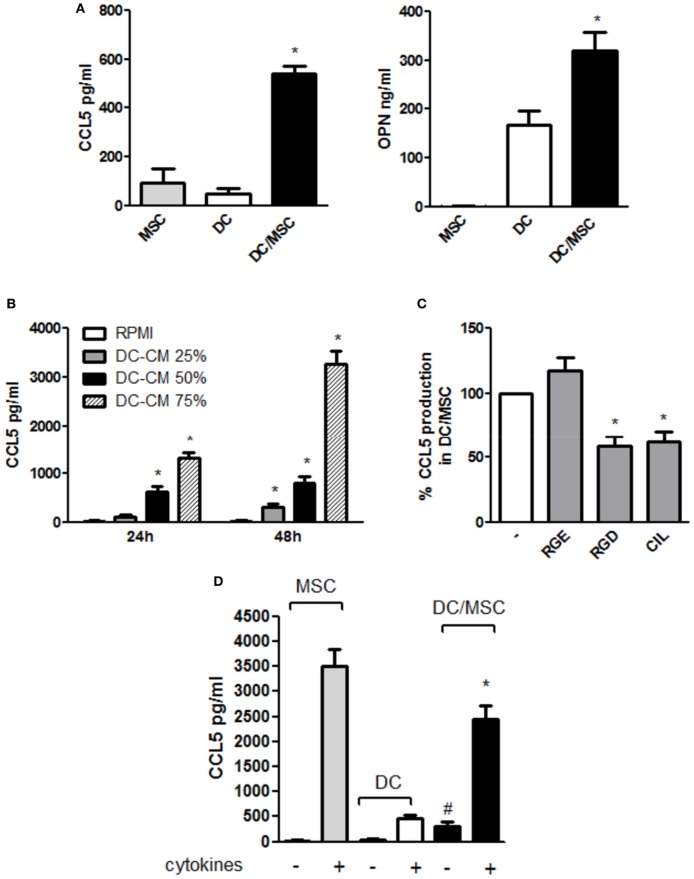
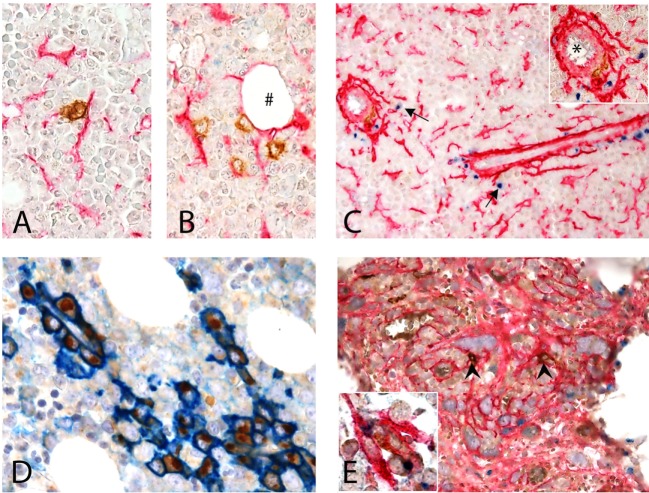
Mesenchymal stromal cells (MSCs) exert immunosuppressive effects on immune cells including dendritic cells (DCs). However, many details of the bidirectional interaction of MSCs with DCs are still unsolved and information on key molecules by which DCs can modulate MSC functions is limited. Here, we report that osteopontin (OPN), a cytokine involved in homeostatic and pathophysiologic responses, is constitutively expressed by DCs and regulated in the DC/MSC cocultures depending on the activation state of MSCs. Resting MSCs promoted OPN production, whereas the production of OPN was suppressed when MSCs were activated by proinflammatory cytokines (i.e., TNF-α, IL-6, and IL-1β). OPN induction required cell-to-cell contact, mediated at least in part, by β1 integrin (CD29). Conversely, activated MSCs inhibited the release of OPN via the production of soluble factors with a major role played by Prostaglandin E2 (PGE2). Accordingly, pretreatment with indomethacin significantly abrogated the MSC-mediated suppression of OPN while the direct addition of exogenous PGE2 inhibited OPN production by DCs. Furthermore, DC-conditioned medium promoted osteogenic differentiation of MSCs with a concomitant inhibition of adipogenesis. These effects were paralleled by the repression of the adipogenic markers PPARγ, adiponectin, and FABP4, and induction of the osteogenic markers alkaline phosphatase, RUNX2, and of the bone-anabolic chemokine CCL5. Notably, blocking OPN activity with RGD peptides or with an antibody against CD29, one of the OPN receptors, prevented the effects of DC-conditioned medium on MSC differentiation and CCL5 induction. Because MSCs have a key role in maintenance of bone marrow (BM) hematopoietic stem cell niche through reciprocal regulation with immune cells, we investigated the possible MSC/DC interaction in human BM by immunohistochemistry. Although DCs (CD1c+) are a small percentage of BM cells, we demonstrated colocalization of CD271+ MSCs with CD1c+ DCs in normal and myelodysplastic BM. OPN reactivity was observed in occasional CD1c+ cells in the proximity of CD271+ MSCs. Altogether, these results candidate OPN as a signal modulated by MSCs according to their activation status and involved in DC regulation of MSC differentiation.

Keywords: adipogenesis; ccl5; dendritic cells; mesenchymal stromal cells; osteogenesis; osteopontin.


Figures

Figure 1
Figure 1
Influence of mesenchymal stromal cells (MSCs) on osteopontin (OPN) production by dendritic cells (DCs). (A) DCs were cultured alone or with MSCs (ratio DC/MSC 5:1) in the absence or in the presence of the proinflammatory cytokines (IL-1β, TNF-α, IL-6) for 24 h and OPN levels was determined in the supernatants by ELISA. Results are expressed as mean ± SEM of 10 independent experiments. *p < 0.05 vs. DCs alone in resting conditions #p < 0.05 vs. DC/MSC coculture in resting conditions and vs. DCs alone in presence of cytokines by Student’s t-test. (B) DCs were cultured without MSCs or with MSCs in contact or in transwell systems for 24 h in resting conditions (left panel) or in presence of proinflammatory cytokines (right panel). Tested ratio were DC/MSC 5:1. OPN levels were measured by ELISA and expressed as % of OPN production by DCs alone set as 100% (mean ± SEM of five independent experiments). *p < 0.05 vs. DCs alone by Student’s t-test.
Figure 2
Figure 2
Mechanisms involved in the regulation of osteopontin (OPN) production in DC/mesenchymal stromal cells (MSC) cocultures. (A) MSCs were pretreated for 1 h with the specific neutralizing antibodies against CD44, CD29, CD54, and CD58 or the corresponding isotype ctrl (mIgG1) and then cultured with dendritic cells (DCs) (ratio DC/MSC 5:1) for 48 h. Supernatants were collected and tested for OPN production by ELISA. OPN levels are expressed as % of OPN production in DC/MSC alone set as 100% (mean ± SEM of four independent experiments). *p < 0.05 vs. DC/MSC coculture untreated by Student’s t-test. (B) DCs were cultured alone or with the addition of conditioned medium from MSCs unstimulated (25% v/v) or with different concentrations of conditioned medium from MSCs activated for 24 h with proinflammatory cytokines (MSC-CM or cytokines MSC-CM). Supernatants were collected after 24 h and tested for OPN production by ELISA and expressed as % of OPN production by DCs alone set as 100%. *p < 0.05 vs. DCs alone by one-way ANOVA followed by Tukey’s Multiple Comparison Test. (C) PGE2 levels were measured by ELISA in supernatants from MSCs unstimulated or cocultured for 5 days with PBMCs (PBMC/MSC) or untreated or treated for 24 h with proinflammatory cytokines (cytokines MSC). Results are representative of four and three experiments, respectively. *p < 0.05 vs. MSC unstimulated by Student’s t-test. (D) DCs were cultured alone (no CM) or in the presence of supernatants from MSCs stimulated with proinflammatory cytokines for 24 h (cytokines MSC-CM) or co-cultured with PBMC (ratio PBMC/MSC 5:1) for 5 days (PBMC/MSC-CM). MSC stimulation was performed with or without indomethacin (IDM). After 24 h, DC supernatants were collected and tested for OPN production by ELISA. Results are expressed as % of OPN production by DCs alone set as 100% (mean ± SEM of six independent experiments). *p < 0.05 vs. DCs alone (no CM); #p < 0.05 vs. MSC-CM without IDM (ctrl) by one-way ANOVA followed by Tukey’s Multiple Comparison Test. (E) DCs were stimulated with different concentrations of PGE2. Supernatants were harvested 24 h later and subjected to OPN ELISA (left panel) (mean ± SEM of six independent experiments). DCs were stimulated with Sulprostone (EP1/3 agonist), Butaprost (EP2 agonist), Misoprostol (EP2/3/4 agonist), PGE2, Forskolin (FSK), and dcAMP. After 24 h, supernatants were collected and tested for OPN by ELISA (right panel) (mean ± SEM of four independent experiments). Results are expressed as % of OPN production by DCs alone set as 100%; *p < 0.05 vs. DCs alone by one-way ANOVA followed by Dunnett’s Multiple Comparison Test.
Figure 3
Figure 3
DC-conditioned medium inhibits mesenchymal stromal cells (MSC) differentiation into adipocytes through osteopontin release. (A) MSCs were cultured for 15 days in adipocyte differentiation medium in the presence of 30% DC-CM or RPMI (control condition, ctrl) and stained with Oil Red O to reveal lipid droplets (original magnification 5×) (left panel). Adipocytes were counted in five random fields from one representative well per group (middle panel) and Oil Red O extracted with isopropanol was measured at optical density 490 (right panel) (mean ± SEM of four independent wells). *p < 0.05 vs. ctrl by Student’s t-test. (B) The mRNA levels of ADIPOQ, FABP4, and PPARγ2 were analyzed by real-time PCR at days 5 and 12 of culture. Data were shown as means ± SEM (n = 3). *p < 0.05 vs. ctrl by Student’s t-test. (C) MSCs were examined for the expression of CD29 and CD44 by flow cytometry (gray area, isotype control; white area, specific antibody). MSCs were induced by adipogenic differentiation medium in control condition, with rhOPN or DC-CM in the presence or the absence of the indicated antibodies. Relative mRNA expression of ADIPOQ and FABP4 was measured by real-time PCR on day 12 of adipogenic induction. RPL13A was used for normalization. Data were shown as means ± SEM (n = 3). *p < 0.05 vs. ctrl; #p < 0.05 vs DC-CM in presence of the isotype control by one-way ANOVA followed by Tukey’s Multiple Comparison Test.
Figure 4
Figure 4
DC-conditioned medium induces mesenchymal stromal cells (MSC) differentiation into osteoblasts through osteopontin release. (A) MSCs were cultured for 14 and 21 days in osteogenic differentiation medium in the presence of 30% DC-CM or RPMI (control condition, ctrl) and stained with Alizarin Red S to identify mineralized deposits. (B) Quantification of Alizarin Red staining via dissolving the dye and measurement of subsequent absorption at optical density of 405 nm. *p < 0.05 vs. ctrl by Student’s t-test. (C) The mRNA levels of alkaline phosphatase, RUNX, and CCL5 were analyzed by real-time PCR at days 7 and 14 of culture of MSC in presence of DC-CM or rhOPN. RPL13A was used for normalization. Data were shown as means ± SEM (n = 3). *p < 0.05 vs. ctrl by Student’s t-test.
Figure 5
Figure 5
Osteopontin (OPN) released by dendritic cells (DCs) modulates CCL5 production in DC/mesenchymal stromal cells (MSC) coculture. (A) DCs were cultured in the absence or in the presence of MSCs. Supernatants were harvested after 48 h and assayed by ELISA for CCL5 (left) and OPN (right) (mean ± SEM of four independent experiments). *p < 0.05 vs. DC alone by one-way ANOVA followed by Tukey’s Multiple Comparison Test. (B) MSC were incubated for 24 and 48 h with different concentrations of DC conditioned medium (DC-CM) and CCL5 concentrations were measured in the supernatants by ELISA (mean ± SEM of four independent experiments). *p < 0.05 vs. MSC alone at 24 and 48 h, respectively by Student’s t-test. (C) DCs and MSCs were cocultured for 48 h in the presence or in the absence of the antagonistic integrin inhibitors RGD (10 µg/ml) and cilengitide (CIL) (2 µg/ml). RGE was used as a control peptide. CCL5 concentrations were tested by ELISA. Results are expressed as % of CCL5 production by DC/MSC set as 100% and are representative of four independent experiments. *p < 0.05 vs. DC/MSC coculture in presence of RGE by Student’s t-test. (D) DCs were cultured alone or with MSCs (ratio DC/MSC 5:1) in the absence or in the presence of the proinflammatory cytokines (IL-1β, TNF-α, IL-6) for 48 h and OPN levels was determined in the supernatants by ELISA (mean ± SEM of seven different experiments). #p < 0.05 vs. DCs alone in the absence of cytokines; *p < 0.05 vs. MSCs alone in the presence of cytokines by Student’s t-test.
Figure 6
Figure 6
Interaction of CD1c + dendritic cells (DCs) and CD271 + mesenchymal stromal cells (MSCs) in human BM. (A–D) Normal BM. (A,B) Show the interaction of CD1c+ (brown) DCs with CD271/NGFR+ (red) MSCs in the interstitium of normal hematopoietic matrix, even near an adipocyte (#). (C) Shows this interaction next to a vessel (*) in the proximity of which osteopontin (OPN) (blu) is produced (arrows). Double immunostaining for CD38 (blue) and OPN (brown) showed that plasma cells are the major expressors of OPN in normal human BM (D). (E) BM with myelofibrosis: intertrabecular spaces show dense network of CD271+ MSCs (red) that interact with scattered CD1c+ DCs (brown, arrow heads); in this contest, OPN (blue) production can be detected [(E), inset].
Figure 7
Figure 7
Hypothetical model for osteopontin (OPN) production in dendritic cell (DC)/mesenchymal stromal cells (MSC) cross-talk. In the perivascular area of the hematopoietic niche, DC/MSC interaction results in upregulation of OPN and CCL5 that influences the balance between osteogenesis and adipogenesis of MSCs.

Similar articles

Cited by

References

    1. Pittenger MF, Mackay AM, Beck SC, Jaiswal RK, Douglas R, Mosca JD, et al. Multilineage potential of adult human mesenchymal stem cells. Science (1999) 284(5411):143–7.10.1126/science.284.5411.143 - DOI - PubMed
    1. da Silva Meirelles L, Chagastelles PC, Nardi NB. Mesenchymal stem cells reside in virtually all post-natal organs and tissues. J Cell Sci (2006) 119(Pt 11):2204–13.10.1242/jcs.02932 - DOI - PubMed
    1. Bifari F, Lisi V, Mimiola E, Pasini A, Krampera M. Immune modulation by mesenchymal stem cells. Transfus Med Hemother (2008) 35(3):194–204.10.1159/000128968 - DOI - PMC - PubMed
    1. Wang Y, Chen X, Cao W, Shi Y. Plasticity of mesenchymal stem cells in immunomodulation: pathological and therapeutic implications. Nat Immunol (2014) 15(11):1009–16.10.1038/ni.3002 - DOI - PubMed
    1. Uccelli A, Moretta L, Pistoia V. Mesenchymal stem cells in health and disease. Nat Rev Immunol (2008) 8:726–36.10.1038/nri2395 - DOI - PubMed

Publication types