. 2018 May 1;9(21):4879-4891.
doi: 10.1039/c8sc01615a. eCollection 2018 Jun 7.

Electron transfer in an acidophilic bacterium: interaction between a diheme cytochrome and a cupredoxin

Affiliations

Electron transfer in an acidophilic bacterium: interaction between a diheme cytochrome and a cupredoxin

X Wang et al. Chem Sci. .

Abstract

Acidithiobacillus ferrooxidans, a chemolithoautotrophic Gram-negative bacterium, has a remarkable ability to obtain energy from ferrous iron oxidation at pH 2. Several metalloproteins have been described as being involved in this respiratory chain coupling iron oxidation with oxygen reduction. However, their properties and physiological functions remain largely unknown, preventing a clear understanding of the global mechanism. In this work, we focus on two metalloproteins of this respiratory pathway, a diheme cytochrome c4 (Cyt c4) and a green copper protein (AcoP) of unknown function. We first demonstrate the formation of a complex between these two purified proteins, which allows homogeneous intermolecular electron-transfer in solution. We then mimic the physiological interaction between the two partners by replacing one at a time with electrodes displaying different chemical functionalities. From the electrochemical behavior of individual proteins, we show that, while electron transfer on AcoP requires weak electrostatic interaction, electron transfer on Cyt c4 tolerates different charge and hydrophobicity conditions, suggesting a pivotal role of this protein in the metabolic chain. The electrochemical study of the proteins incubated together demonstrates an intermolecular electron transfer involving the protein complex, in which AcoP is reduced through the high potential heme of Cyt c4. Modelling of the electrochemical signals at different scan rates allows us to estimate the rate constant of this intermolecular electron transfer in the range of a few s-1. Possible routes for electron transfer in the acidophilic bacterium are deduced.


Figures

Scheme 1
Scheme 1. Iron respiratory chain of Acidithiobacillus ferrooxidans. Proteins known to be involved in the iron respiratory chain of A. ferrooxidans are depicted using Pymol Software. The structures of Cyt c4 (PDB: ; 1h1o) and Rus (PDB: ; 1RCY) are known. CcO of Paracoccus denitrificans is depicted (PDB: ; 3HB3) as an enzyme closely related to CcO of A. ferrooxidans. The structure of AcoP has been predicted using the Phyre 2 server and the transmembrane segment has been added. The structure of Cyc 2 was predicted.
Fig. 1
Fig. 1. AcoP : Cyt c4 complex formation in solution from purified proteins. (A) Structure prediction and purified AcoP in solution or loaded on SDS-PAGE gel. The structure prediction of AcoP using the Phyre 2 server is in agreement with a cupredoxin fold mainly composed of β sheets previously observed by circular dichroism. The 4 residues identified as copper ligands are depicted in blue and are found in close proximity to the copper center (green sphere) which validate the model; (B) structure and purified Cyt c4 in solution or loaded on SDS-PAGE gel and blue stained. The structure (PDB: ; 1H1O) is shown in grey with the two hemes in magenta; (C) 5 μl of 100 μM Cyt c4, AcoP or AcoP : Cyt c4 1 : 1 complex were loaded on a “Modified-native” gel. An additional band labeled (*) is observed when the complex AcoP : Cyt c4 migrates on the gel. When mentioned the AcoP : Cyt c4 complex was incubated with 700 μM ascorbate before migration.
Fig. 2
Fig. 2. (A) UV-vis spectra of 15 μM AcoP “as prep” (light grey), 15 μM reduced Cyt c4 (dark grey), and AcoP/Cyt c4 1 : 1 mix (15 μM of each in the final mixture) (black) in 20 mM NaAC buffer, pH 4.8. Inset: typical spectra of oxidized Cyt c4 obtained after the addition of K2IrCl6 (black dashed line) or of reduced Cyt c4 obtained after the addition of ascorbate (grey dashed line); (B) EPR spectra of 100 μM AcoP “as prep” (light grey), 100 μM Cyt c4 untreated (dark grey) and AcoP/Cyt c4 1 : 1 mix (100 μM of each in the final mixture) (black) in 20 mM NaAc buffer, pH 4.8. Acquisition parameters: temperature = 15 K, microwave frequency = 9479 MHz, microwave power = 0.2 mW, and modulation amplitude = 2 mT. Inset: magnification of the gz-peak region of low-spin hemes (microwave power = 4 mW).
Fig. 3
Fig. 3. (A–C) CVs of 50 μM AcoP at a PG electrode in the membrane configuration at pH 4.8 (A), pH 7 (B), and pH 3.5 (C) in 20 mM NH4AC buffer, before (black solid lines) and after the addition of 200 mM NaCl (black dashed line). v = 20 mV s–1. Grey solid lines represent the CVs with no protein; (D) CD spectra of AcoP at different pHs in 10 mM NH4AC buffer at room temperature; (E) ATR-FTIR spectra of AcoP at 20 μM in 10 mM NH4AC at pH 4.8 (solid line) and pH 2.8 (dashed line).
Fig. 4
Fig. 4. Impact of pH on exposed AcoP amino acids. (A) Hydrophobic surfaces (light green) depicted using Pymol software on the predicted structure of AcoP. (B) Dipole moment of AcoP and the number of charged atoms at different pHs using the Protein Dipole Moments server. (C) Electrostatic charges at the surface of AcoP as a function of pH is shown using Pymol with the following color code: positive charges in blue, negative charges in red, and neutral in white.
Fig. 5
Fig. 5. AcoP behavior on SAMs. (A) PMIRRAS spectrum of AcoP at 20 μM adsorbed for 1 h on MHA-Au in 10 mM NH4AC at pH 4.8 (solid line) and pH 2.8 (dashed line); (B) SWVs of AcoP adsorbed on MHA (solid line) or BT (dashed line) in 10 mM NH4AC at pH 4.8; (C) PMIRRAS spectra of AcoP at 20 μM in 10 mM NH4AC at pH 4.8 adsorbed for 1 h on MHA-Au (solid line) or BT-Au (dashed line).
Fig. 6
Fig. 6. (A–C) CVs of 50 μM Cyt c4 at a PG electrode in the membrane configuration at pH 4.8 (A), pH 7 (B), and pH 3.5 (C) in 20 mM NH4AC buffer, before (black solid lines) and after the addition of 200 mM NaCl (black dashed line). v = 20 mV s–1. Grey solid lines represent the CVs with no protein; (D) CV of Cyt c4 adsorbed at the PG electrode at 5, 10, 20, 50 and 100 mV s–1; (E) CD spectra of Cyt c4 at different pHs in NH4AC 10 mM buffer at room temperature; (F) SWVs on MHA (short dashed line), 4-ATP (dashed line) and BT (solid line) in 20 mM NH4AC buffer pH 4.8.
Fig. 7
Fig. 7. Impact of pH on exposed Cyt c4 amino acids. (A) Hydrophobic surfaces (light green) depicted using Pymol software on the predicted structure of Cyt c4. (B) Dipole moment of Cyt c4 and the number of charged atoms at different pHs obtained using the Protein Dipole Moments Server. (C) Electrostatic charges at the surface of Cyt c4 as a function of pH is shown using Pymol with the following color code: positive charges in blue, negative charges in red, and neutral in white.
Fig. 8
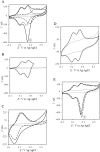
Fig. 8. Electrochemical behavior of the AcoP : Cyt c4 complex at a PG electrode in the membrane configuration. (A) CV of 100 μM AcoP (dashed line), 100 μM Cyt c4 (short dashed line), and the 1 : 1 mixture of AcoP and Cyt c4 (100 μM of each in the final mixture) (solid line); (B) CV of the 1 : 1 mixture of AcoP and Cyt c4 in a restricted potential window; (C) CV of horse heart Cyt c (dashed line) and the 1 : 1 mixture of AcoP and Cyt c (solid line); (D) CV of the 1 : 1 mixture of AcoP H166A and Cyt c4; (E) CV of the 1 : 1 mixture of AcoP and Cyt c4 before (solid line) and after the addition of 400 mM NaCl (dashed line). Peak before (solid line) and after the addition of 400 mM NaCl (dashed line). Peak ① represents the intermolecular ET process. Grey solid lines represent the CVs with no protein. pH 4.8, 20 mM NH represents the intermolecular ET process. Grey solid lines represent the CVs with no protein. pH 4.8, 20 mM NH4AC, 20 mV s–1.
Scheme 2
Scheme 2. Electrochemical and chemical steps involved in the ET pathway from the oxidized form of the AcoP and HemeH Cyt c4 complex to the reduced form explaining the appearance of peak complex to the reduced form explaining the appearance of peak ① observed in observed in Fig. 8.
Fig. 9
Fig. 9. Effect of the scan rate and pH on the electrochemical behavior of the AcoP : Cyt c4 complex at a PG electrode in the membrane configuration. CV at 2 mV s–1 of AcoP (long dashed line), Cyt c4 (short dashed line), and the 1 : 1 mixture of AcoP and Cyt c4 (solid line) at (A) pH 4.8 and (B) pH 2.8; (C) CVs as in (A) but at 200 mV s–1 and pH 4.8; grey solid lines represent the CVs with no protein in 20 mM NH4AC buffer.
Fig. 10
Fig. 10. Modelling of the CVs showing the influence of three different constants, the heterogeneous electron transfer constant of AcoP (k0), the kinetic rate constant of the complex formation (kas) and the constant of the intermolecular electron transfer within the complex (kinter), on the shape of the simulated voltammograms at 20 mV s–1 (capacitive current is excluded).
Scheme 3
Scheme 3. Proposed model of ET between redox proteins and the electrode surface observed on PG electrodes (see Fig. 8). Dashed lines represent PG electrodes. Structures of Cyt c4 or predicted AcoP are presented in grey ribbons with their respective redox centers, hemes (in red) and copper (in blue). (A) Interfacial ET between the electrode and the two heme centers, a reversible process, illustrated by black arrows; (B) slow interfacial ET between the AcoP copper center and the electrode shown by a dashed arrow; (C) additional intermolecular ET pathway within the AcoP : Cyt c4 complex depicted by a green arrow. This complex has been modelled with the HADDOCK web server by driving the docking with the constraint based on AcoP interacting with HemeH of Cyt c4.

Similar articles

Cited by

References

    1. Quatrini R., Johnson D. B. Curr. Opin. Microbiol. 2018;43:139–147. - PubMed
    1. Cardenas J. P., Quatrini R., Holmes D. S. Res. Microbiol. 2016;167:529–538. - PubMed
    1. Chabert N., Bonnefoy V., Achouak W. Microb. Biotechnol. 2018;11:136–140. - PMC - PubMed
    1. Ferguson S. J., Ingledew W. J. Biochim. Biophys. Acta. 2008;1777:1471–1479. - PubMed
    1. Roger M., Castelle C., Guiral M., Infossi P., Lojou E., Giudici-Orticoni M. T., Ilbert M. Biochem. Soc. Trans. 2012;40:1324–1329. - PubMed