. 2017 May;1(5):1600038.
doi: 10.1002/adbi.201600038. Epub 2017 Apr 3.

Targeting Tumor-Associated Exosomes with Integrin-Binding Peptides

Affiliations

Targeting Tumor-Associated Exosomes with Integrin-Binding Peptides

Randy P Carney et al. Adv Biosyst. 2017 May.

Abstract

All cells expel a variety of nano-sized extracellular vesicles (EVs), including exosomes, with composition reflecting the cells' biological state. Cancer pathology is dramatically mediated by EV trafficking via key proteins, lipids, metabolites, and microRNAs. Recent proteomics evidence suggests that tumor-associated exosomes exhibit distinct expression of certain membrane proteins, rendering those proteins as attractive targets for diagnostic or therapeutic application. Yet, it is not currently feasible to distinguish circulating EVs in complex biofluids according to their tissue of origin or state of disease. Here we demonstrate peptide binding to tumor-associated EVs via overexpressed membrane protein. We find that SKOV-3 ovarian tumor cells and their released EVs express α3β1 integrin, which can be targeted by our in-house cyclic nonapeptide, LXY30. After measuring bulk SKOV-3 EV association with LXY30 by flow cytometry, Raman spectral analysis of laser-trapped single exosomes with LXY30-dialkyne conjugate enabled us to differentiate cancer-associated exosomes from non-cancer exosomes. Furthermore, we introduce the foundation for a highly specific detection platform for tumor-EVs in solution with biosensor surface-immobilized LXY30. LXY30 not only exhibits high specificity and affinity to α3β1 integrin-expressing EVs, but also reduces EV uptake into SKOV-3 parent cells, demonstrating the possibility for therapeutic application.

Keywords: biosensor; cancer; diagnostics; exosomes; optical tweezers.


Figures

Figure 1
Figure 1
Confirmation of exosome-type for vesicles isolated from SKOV-3 ovarian tumor cells. (a) Western blot analysis for CD63, CD9, tsg101, calnexin, and α3 and β1 integrins in SKOV-3 cell lysate (CL) and exosome (Exo) preparations (20 μg protein per lane). (b) Electron micrograph of exosomes by negative-stained conventional EM showing the typical cup shape morphology. (c) AFM amplitude image of isolated exosomes deposited on mica. (d) Exosome number concentration and size distribution by NTA, with red bars representing one standard deviation.
Figure 2
Figure 2
On-bead flow cytometry (FC). (a) Chemical structure of the LXY30 peptide. For flow cytometry measurement, the N-terminus of the peptide is coupled to a FITC dye molecule via PEGylated spacer. (b) Exosomes tagged with fluorescently-labeled antibody or peptide are bound to sulfate/aldehyde-coated latex beads for FC measurement. (c) Flow cytometry profiles of fluorescence-labeled LXY30 (green), scr-LXY30 (red), and anti-α3 (blue) binding to SKOV-3 cells (left) or exosomes (right). Exosomes from healthy human plasma showed limited binding to scr-LXY30 (dotted red) and scr-LXY30 (dotted green).
Figure 3
Figure 3
Laser trapping Raman spectroscopy (LTRS) of SKOV-3 EV binding to Raman-tagged LXY30. Top: Normalized Raman spectra for LXY30-RT peptide. Bottom: Raman spectra for SKOV-3 EVs before (green) and after (red) LXY30-RT addition. When the spectra are overlaid, two prominent peaks indicative of the chemical shifts for the Raman tag become apparent (highlighted in yellow). The solid line and shaded area represent the average and one standard deviation.
Figure 4
Figure 4
(a) Representative Raman spectra (without normalization) for single vesicles mixed with LXY30-RT peptide. In this wavenumber region, peaks originate either from the LXY30-RT (centered near 1600 cm−1) or from the exosomal contents (amide region centered near 1650 cm−1). Spectra are colored and numbered for ease in comparison. Gaussian curve fitting was used to distinguish peak A from peak B and obtain peak heights (e.g. spectra #2 is plotted above the raw data). (b) Measured heights of peak A and peak B for each spectrum, and their ratios, listed in descending order by peak B height. The ratios are not constant, indicating that stoichiometry may not be fixed across exosome size as might be expected, and moreover varies widely from vesicle to vesicle.
Figure 5
Figure 5
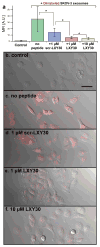
Effect of LXY30-binding on cell uptake. (a) Quantification of exosome uptake between conditions by measuring the mean fluorescence intensity (MFI) per SKOV-3 cell in representative CLSM images. (b) CLSM control image of SKOV-3 cells with no DiI-labeled exosomes added. The remaining images represent the conditions where DiI-labeled exosomes were added to cells after pre-mixing with (c) no peptide, (d) 1 μM scr-LXY30, (e) 1 μM LXY30, and (f) 10 μM LXY30. The scale bar is 20 μm. * represents p < 0.005.
Figure 6
Figure 6
On-chip capture of tumor EVs. (a) MP-SPR detection platform for tumor SKOV-3 exosomes using the surface-immobilized LXY30 capturing peptide. Each step of the peptide immobilization via streptavidin-biotin conjugation can be followed by SPR response. (b) Sensorgram of the SKOV-3 exosome detection following biotin-PEG-SH self-assembled monolayer (SAM) formation. First, streptavidin was injected to both flow channels, followed by injections of LXY30-biotin in flow cell 1 only. Finally, SKOV-3 exosomes were injected to both flow channels. The characteristic adsorption outlined by the dotted box was modeled for extraction of kinetic parameters (Figure 7).
Figure 7
Figure 7
Kinetic modeling of MP-SPR sensorgrams. (a) The solid black line shows the measured data during the three injections while the red, blue, and pink dashed lines depict the fitted data for the hypothesized cases of (i) 1%, (ii) 5%, and (iii) 10% coverage of α3β1 integrin on the surface of a SKOV-3 exosome. (b) Full SPR angular spectra recorded at various time points during the experiments; the black line represents the initial situation whereby the gold sensor surface and SAM layer were measured, the red line illustrates the events after the streptavidin injection and the following baseline stabilization, and the blue line is a snapshot after all three SKOV-3 concentrations were injected and a stable baseline was observed. The pink dashed line depicts the modeled fitting at the last phase of the interactions, i.e. following the three SKOV-3 injections.

References

    1. Society AC. Cancer Facts & Figures. 2015
    1. Harding CV, Heuser JE, Stahl PD. The Journal of Cell Biology. 2013;200:367. - PMC - PubMed
    1. Dorayappan KDP, Wallbillich JJ, Cohn DE, Selvendiran K. Gynecologic Oncology. 2016 doi: 10.1016/j.ygyno.2016.03.036. - DOI - PMC - PubMed
    1. Gerçel-Taylor C, Atay S, Tullis RH, Kesimer M, Taylor DD. Analytical Biochemistry. 2012;428:44. - PubMed
    1. Akers JC, Ramakrishnan V, Kim R, Phillips S, Kaimal V, Mao Y, Hua W, Yang I, Fu C, Nolan J, Nakano I, Yang Y, Beaulieu M, Carter BS, Chen CC. J Neurooncol. 2015;123:205. - PMC - PubMed