

Quantifying local tumor morphological changes with Jacobian map for prediction of pathologic tumor response to chemo-radiotherapy in locally advanced esophageal cancer
- PMID: 29911659
- PMCID: PMC6064042
- DOI: 10.1088/1361-6560/aacd22
Quantifying local tumor morphological changes with Jacobian map for prediction of pathologic tumor response to chemo-radiotherapy in locally advanced esophageal cancer
Abstract
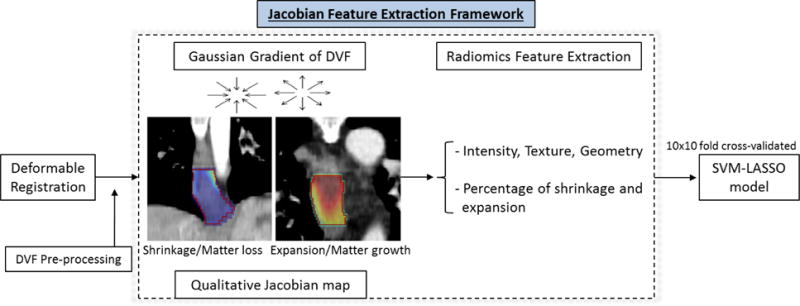
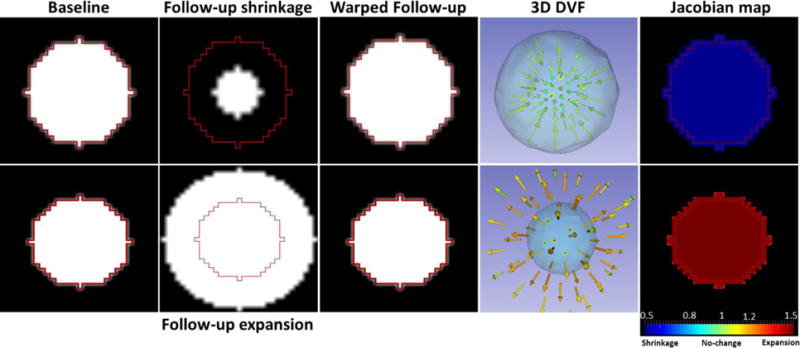
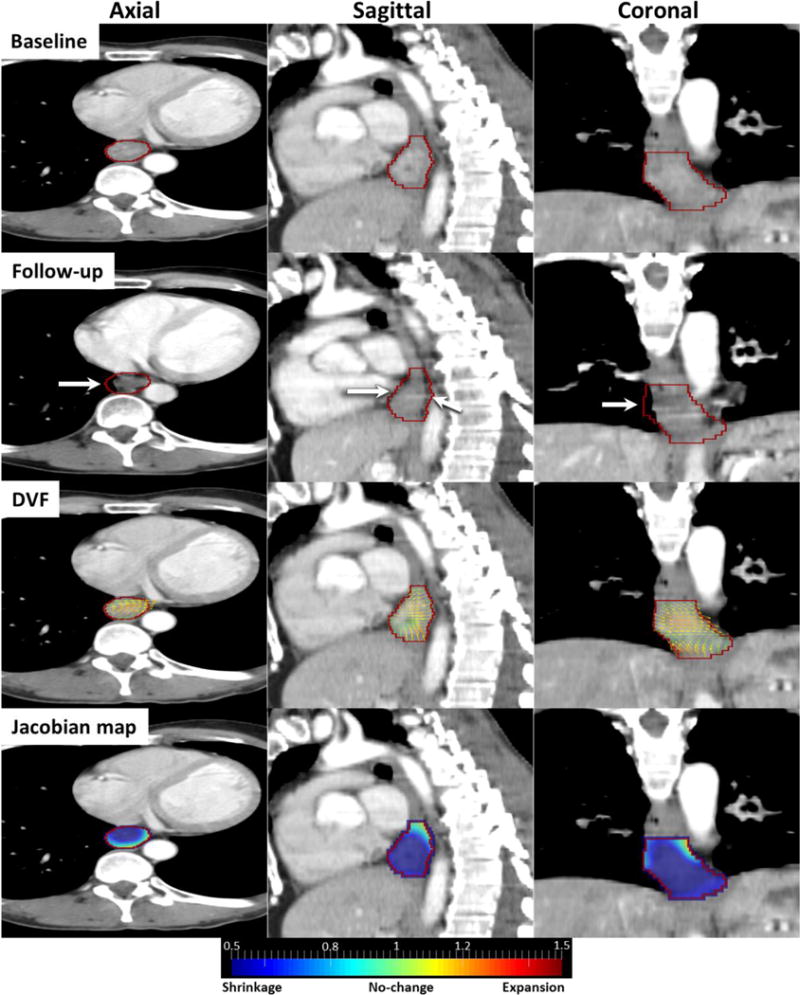
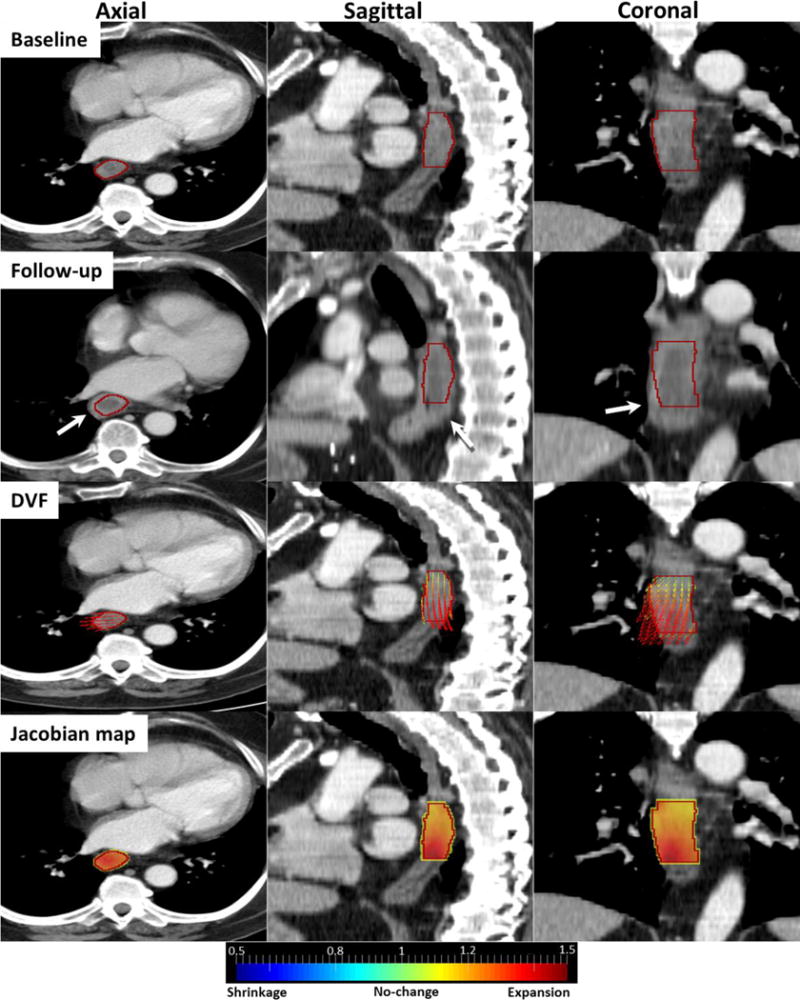
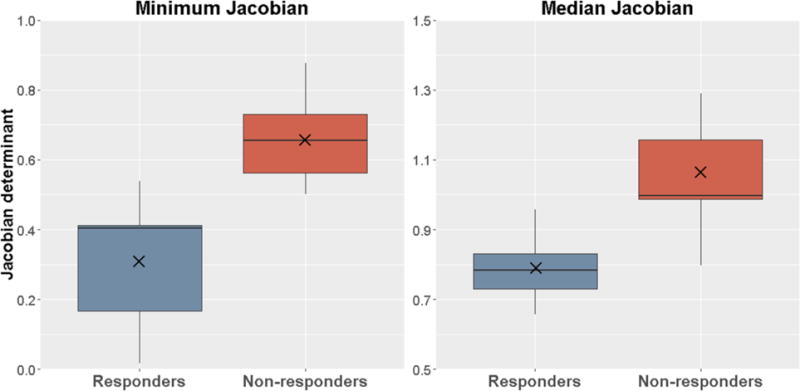
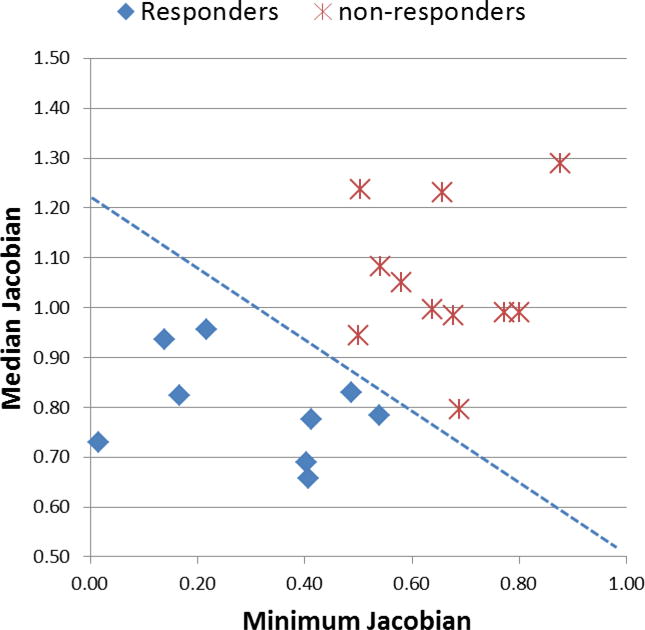
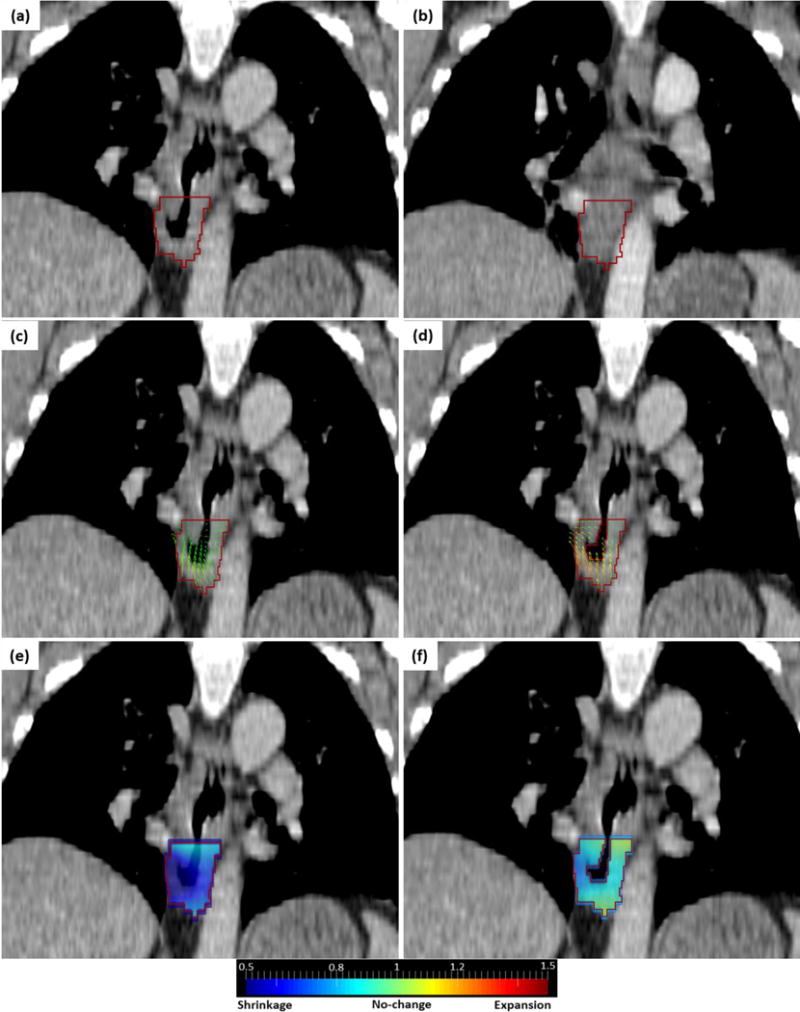
We proposed a framework to detect and quantify local tumor morphological changes due to chemo-radiotherapy (CRT) using a Jacobian map and to extract quantitative radiomic features from the Jacobian map to predict the pathologic tumor response in locally advanced esophageal cancer patients. In 20 patients who underwent CRT, a multi-resolution BSpline deformable registration was performed to register the follow-up (post-CRT) CT to the baseline CT image. The Jacobian map (J) was computed as the determinant of the gradient of the deformation vector field. The Jacobian map measured the ratio of local tumor volume change where J < 1 indicated tumor shrinkage and J > 1 denoted expansion. The tumor was manually delineated and corresponding anatomical landmarks were generated on the baseline and follow-up images. Intensity, texture and geometry features were then extracted from the Jacobian map of the tumor to quantify tumor morphological changes. The importance of each Jacobian feature in predicting pathologic tumor response was evaluated by both univariate and multivariate analysis. We constructed a multivariate prediction model by using a support vector machine (SVM) classifier coupled with a least absolute shrinkage and selection operator (LASSO) for feature selection. The SVM-LASSO model was evaluated using ten-times repeated 10-fold cross-validation (10 × 10-fold CV). After registration, the average target registration error was 4.30 ± 1.09 mm (LR:1.63 mm AP:1.59 mm SI:3.05 mm) indicating registration error was within two voxels and close to 4 mm slice thickness. Visually, the Jacobian map showed smoothly-varying local shrinkage and expansion regions in a tumor. Quantitatively, the average median Jacobian was 0.80 ± 0.10 and 1.05 ± 0.15 for responder and non-responder tumors, respectively. These indicated that on average responder tumors had 20% median volume shrinkage while non-responder tumors had 5% median volume expansion. In univariate analysis, the minimum Jacobian (p = 0.009, AUC = 0.98) and median Jacobian (p = 0.004, AUC = 0.95) were the most significant predictors. The SVM-LASSO model achieved the highest accuracy when these two features were selected (sensitivity = 94.4%, specificity = 91.8%, AUC = 0.94). Novel features extracted from the Jacobian map quantified local tumor morphological changes using only baseline tumor contour without post-treatment tumor segmentation. The SVM-LASSO model using the median Jacobian and minimum Jacobian achieved high accuracy in predicting pathologic tumor response. The Jacobian map showed great potential for longitudinal evaluation of tumor response.
Conflict of interest statement
The authors have no relevant conflicts of interest to disclose.
Figures
Similar articles
-
Radiomics analysis of pulmonary nodules in low-dose CT for early detection of lung cancer.Med Phys. 2018 Apr;45(4):1537-1549. doi: 10.1002/mp.12820. Epub 2018 Mar 12. Med Phys. 2018. PMID: 29457229 Free PMC article.
-
Modeling pathologic response of esophageal cancer to chemoradiation therapy using spatial-temporal 18F-FDG PET features, clinical parameters, and demographics.Int J Radiat Oncol Biol Phys. 2014 Jan 1;88(1):195-203. doi: 10.1016/j.ijrobp.2013.09.037. Epub 2013 Nov 1. Int J Radiat Oncol Biol Phys. 2014. PMID: 24189128 Free PMC article.
-
Predicting Response to Neoadjuvant Chemoradiotherapy in Esophageal Cancer with Textural Features Derived from Pretreatment 18F-FDG PET/CT Imaging.J Nucl Med. 2017 May;58(5):723-729. doi: 10.2967/jnumed.116.180299. Epub 2016 Oct 13. J Nucl Med. 2017. PMID: 27738011
-
Spatial-temporal [¹⁸F]FDG-PET features for predicting pathologic response of esophageal cancer to neoadjuvant chemoradiation therapy.Int J Radiat Oncol Biol Phys. 2013 Apr 1;85(5):1375-82. doi: 10.1016/j.ijrobp.2012.10.017. Epub 2012 Dec 6. Int J Radiat Oncol Biol Phys. 2013. PMID: 23219566 Free PMC article.
-
Utility of PET, CT, and EUS to identify pathologic responders in esophageal cancer.Ann Thorac Surg. 2004 Oct;78(4):1152-60; discussion 1152-60. doi: 10.1016/j.athoracsur.2004.04.046. Ann Thorac Surg. 2004. PMID: 15464463 Review.
Cited by
-
Radiomics in Oesogastric Cancer: Staging and Prediction of Preoperative Treatment Response: A Narrative Review and the Results of Personal Experience.Cancers (Basel). 2024 Jul 26;16(15):2664. doi: 10.3390/cancers16152664. Cancers (Basel). 2024. PMID: 39123392 Free PMC article. Review.
-
Predictive dose accumulation for HN adaptive radiotherapy.Phys Med Biol. 2020 Nov 27;65(23):235011. doi: 10.1088/1361-6560/abbdb8. Phys Med Biol. 2020. PMID: 33007769 Free PMC article.
-
Use of Artificial Intelligence in Non-Oncologic Interventional Radiology: Current State and Future Directions.Dig Dis Interv. 2021;5(4):331-337. doi: 10.1055/s-0041-1726300. Epub 2021 Jul 17. Dig Dis Interv. 2021. PMID: 35005333 Free PMC article.
-
Early Prediction of Acute Esophagitis for Adaptive Radiation Therapy.Int J Radiat Oncol Biol Phys. 2021 Jul 1;110(3):883-892. doi: 10.1016/j.ijrobp.2021.01.007. Epub 2021 Jan 13. Int J Radiat Oncol Biol Phys. 2021. PMID: 33453309 Free PMC article.
-
Methodological quality of machine learning-based quantitative imaging analysis studies in esophageal cancer: a systematic review of clinical outcome prediction after concurrent chemoradiotherapy.Eur J Nucl Med Mol Imaging. 2022 Jul;49(8):2462-2481. doi: 10.1007/s00259-021-05658-9. Epub 2021 Dec 23. Eur J Nucl Med Mol Imaging. 2022. PMID: 34939174 Free PMC article.
References
-
- Ashburner J, Friston KJ. Human Brain Function. Academic Press; 2004.
-
- Beer AJ, Wieder HA, Lordick F, Ott K, Fischer M, Becker K, Stollfuss J, Rummeny EJ. Adenocarcinomas of esophagogastric junction: multi-detector row CT to evaluate early response to neoadjuvant chemotherapy. Radiology. 2006;239:472–80. - PubMed
-
- Bland JM, Altman DG. Agreement between methods of measurement with multiple observations per individual. J Biopharm Stat. 2007;17:571–82. - PubMed
-
- Blazeby JM, Farndon JR, Donovan J, Alderson D. A prospective longitudinal study examining the quality of life of patients with esophageal carcinoma. Cancer. 2000;88:1781–7. - PubMed
-
- Cao K, Ding K, Amelon RE, Du K. 4D modeling and Estimation of Respiratory Motion for Radiation Therapy. Springer: Biological and Medical Physics and Biomedical Engineering; 2013.
Publication types
MeSH terms
Grants and funding
LinkOut - more resources
Full Text Sources
Other Literature Sources
Medical
Research Materials