

Integrative Analysis of Dysregulated lncRNA-Associated ceRNA Network Reveals Functional lncRNAs in Gastric Cancer
- PMID: 29912172
- PMCID: PMC6027299
- DOI: 10.3390/genes9060303
Integrative Analysis of Dysregulated lncRNA-Associated ceRNA Network Reveals Functional lncRNAs in Gastric Cancer
Abstract
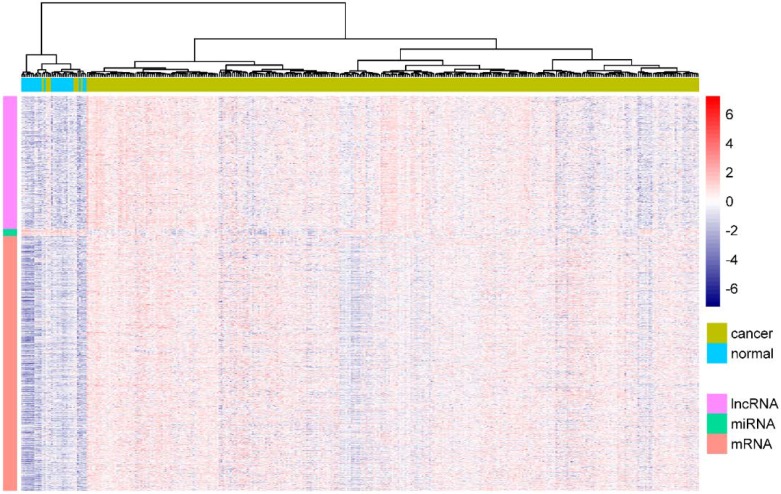
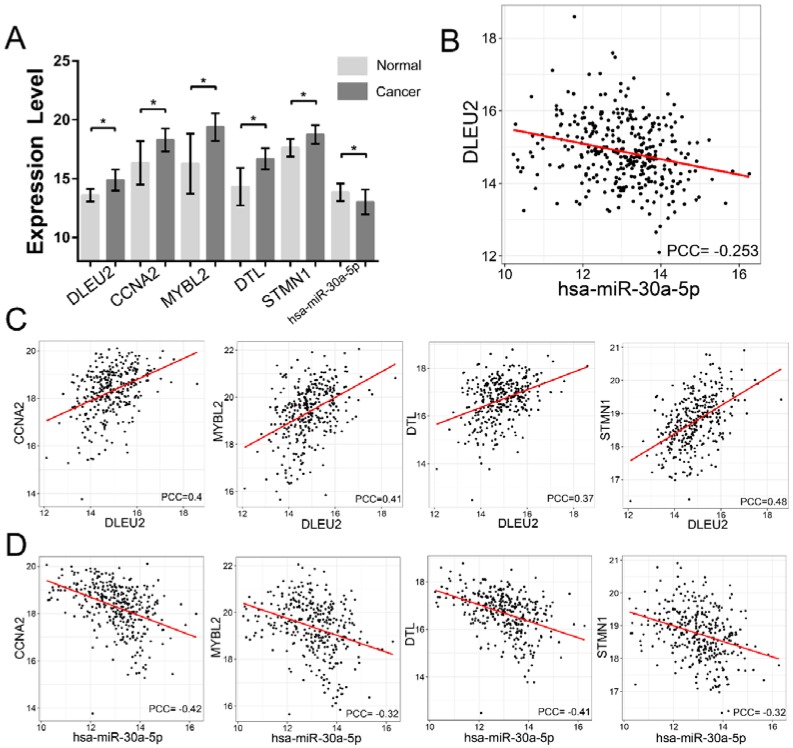
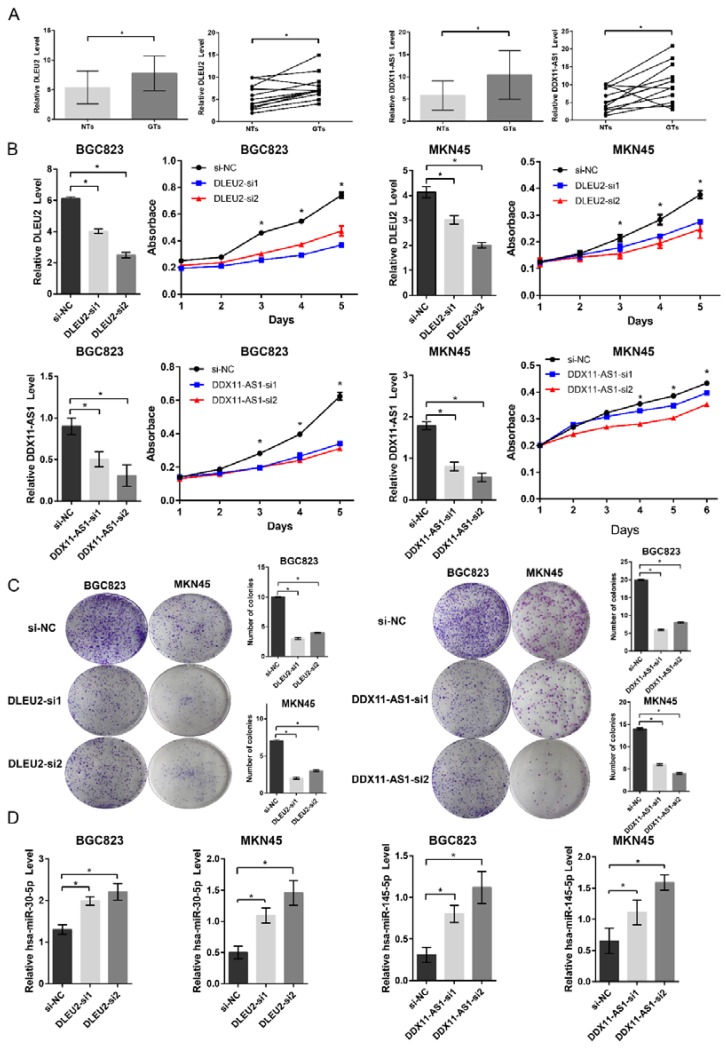
Mounting evidence suggests that long noncoding RNAs (lncRNAs) play important roles in the regulation of gene expression by acting as competing endogenous RNA (ceRNA). However, the regulatory mechanisms of lncRNA as ceRNA in gastric cancer (GC) are not fully understood. Here, we first constructed a dysregulated lncRNA-associated ceRNA network by integrating analysis of gene expression profiles of lncRNAs, microRNAs (miRNAs), and messenger RNAs (mRNAs). Then, we determined three lncRNAs (RP5-1120P11, DLEU2, and DDX11-AS1) as hub lncRNAs, in which associated ceRNA subnetworks were involved in cell cycle-related processes and cancer-related pathways. Furthermore, we confirmed that the two lncRNAs (DLEU2 and DDX11-AS1) were significantly upregulated in GC tissues, promote GC cell proliferation, and negatively regulate miRNA expression, respectively. The hub lncRNAs (DLEU2 and DDX11-AS1) could have oncogenic functions, and act as potential ceRNAs to sponge miRNA. Our findings not only provide novel insights on ceRNA regulation in GC, but can also provide opportunities for the functional characterization of lncRNAs in future studies.
Keywords: DDX11-AS1; DLEU2; competing endogenous RNA; gastric cancer; long non-coding RNA; network analysis.
Conflict of interest statement
The authors declare no conflict of interest.
Figures


Similar articles
-
Analysis of lncRNA-Associated ceRNA Network Reveals Potential lncRNA Biomarkers in Human Colon Adenocarcinoma.Cell Physiol Biochem. 2018;49(5):1778-1791. doi: 10.1159/000493623. Epub 2018 Sep 19. Cell Physiol Biochem. 2018. PMID: 30231249
-
Construction and analysis of dysregulated lncRNA-associated ceRNA network identified novel lncRNA biomarkers for early diagnosis of human pancreatic cancer.Oncotarget. 2016 Aug 30;7(35):56383-56394. doi: 10.18632/oncotarget.10891. Oncotarget. 2016. PMID: 27487139 Free PMC article.
-
Integrated analysis of long non-coding RNA‑associated ceRNA network reveals potential lncRNA biomarkers in human lung adenocarcinoma.Int J Oncol. 2016 Nov;49(5):2023-2036. doi: 10.3892/ijo.2016.3716. Epub 2016 Sep 30. Int J Oncol. 2016. PMID: 27826625
-
Competing endogenous RNA networks and gastric cancer.World J Gastroenterol. 2015 Nov 7;21(41):11680-7. doi: 10.3748/wjg.v21.i41.11680. World J Gastroenterol. 2015. PMID: 26556995 Free PMC article. Review.
-
Systematic analysis reveals a lncRNA-mRNA co-expression network associated with platinum resistance in high-grade serous ovarian cancer.Invest New Drugs. 2018 Apr;36(2):187-194. doi: 10.1007/s10637-017-0523-3. Epub 2017 Oct 30. Invest New Drugs. 2018. PMID: 29082457
Cited by
-
Epithelial-mesenchymal transition-related long noncoding RNAs in gastric carcinoma.Front Mol Biosci. 2022 Oct 12;9:977280. doi: 10.3389/fmolb.2022.977280. eCollection 2022. Front Mol Biosci. 2022. PMID: 36310592 Free PMC article. Review.
-
lncRNA DLEU2 modulates cell proliferation and invasion of non-small cell lung cancer by regulating miR-30c-5p/SOX9 axis.Aging (Albany NY). 2019 Sep 20;11(18):7386-7401. doi: 10.18632/aging.102226. Epub 2019 Sep 20. Aging (Albany NY). 2019. PMID: 31541993 Free PMC article.
-
Identification of Long Non-Coding RNA-Associated Competing Endogenous RNA Network in the Differentiation of Chicken Preadipocytes.Genes (Basel). 2019 Oct 12;10(10):795. doi: 10.3390/genes10100795. Genes (Basel). 2019. PMID: 31614854 Free PMC article.
-
Effect and mechanism of downregulating the long-chain noncoding RNA TM4SF1-AS1 on the proliferation, apoptosis and invasion of gastric cancer cells.World J Surg Oncol. 2021 Jul 31;19(1):226. doi: 10.1186/s12957-021-02334-y. World J Surg Oncol. 2021. PMID: 34330293 Free PMC article.
-
Gastric cancer risk-scoring system based on analysis of a competing endogenous RNA network.Transl Cancer Res. 2020 Jun;9(6):3889-3902. doi: 10.21037/tcr-19-2977. Transl Cancer Res. 2020. PMID: 35117756 Free PMC article.
References
LinkOut - more resources
Full Text Sources
Other Literature Sources
Miscellaneous
