

Models for analyzing zero-inflated and overdispersed count data: an application to cigarette and marijuana use
- PMID: 29912423
- PMCID: PMC7364829
- DOI: 10.1093/ntr/nty072
Models for analyzing zero-inflated and overdispersed count data: an application to cigarette and marijuana use
Abstract
Introduction: This paper describes different methods for analyzing counts and illustrates their use on cigarette and marijuana smoking data.
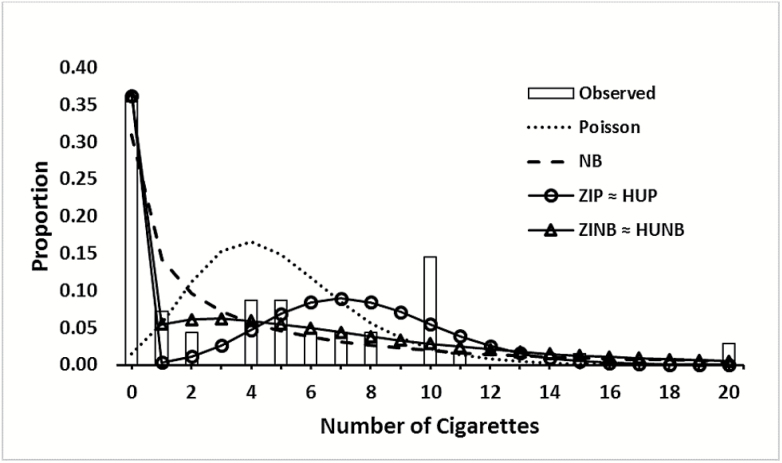
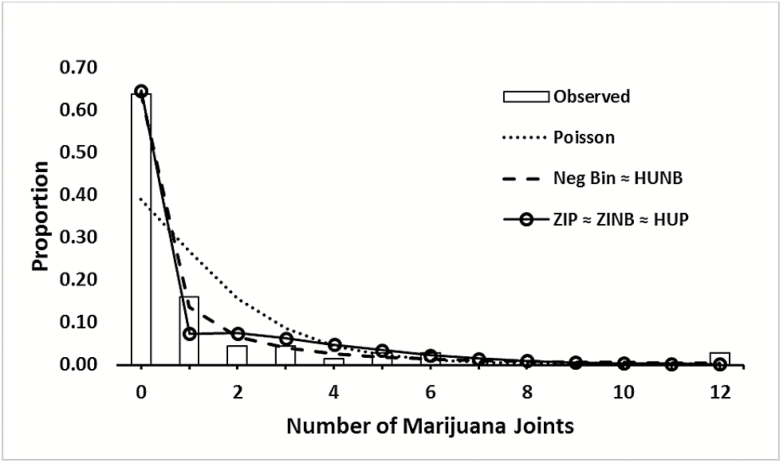
Methods: The Poisson, zero-inflated Poisson (ZIP), hurdle Poisson (HUP), negative binomial (NB), zero-inflated negative binomial (ZINB) and hurdle negative binomial (HUNB) regression models are considered. The different approaches are evaluated in terms of the ability to take into account zero-inflation (extra zeroes) and overdispersion (variance larger than expected) in count outcomes, with emphasis placed on model fit, interpretation, and choosing an appropriate model given the nature of the data. The illustrative data example focuses on cigarette and marijuana smoking reports from a study on smoking habits among youth e-cigarette users with gender, age, and e-cigarette use included as predictors.
Results: Of the 69 subjects available for analysis, 36% and 64% reported smoking no cigarettes and no marijuana, respectively, suggesting both outcomes might be zero-inflated. Both outcomes were also overdispersed with large positive skew. The ZINB and HUNB models fit the cigarette counts best. According to goodness-of-fit statistics, the NB, HUNB, and ZINB models fit the marijuana data well, but the ZINB provided better interpretation.
Conclusion: In the absence of zero-inflation, the NB model fits smoking data well, which is typically overdispersed. In the presence of zero-inflation, the ZINB or HUNB model is recommended to account for additional heterogeneity. In addition to model fit and interpretability, choosing between a zero-inflated or hurdle model should ultimately depend on the assumptions regarding the zeros, study design, and the research question being asked.
Implications: Count outcomes are frequent in tobacco research and often have many zeros and exhibit large variance and skew. Analyzing such data based on methods requiring a normally distributed outcome are inappropriate and will likely produce spurious results. This study compares and contrasts appropriate methods for analyzing count data, specifically those with an over-abundance of zeros, and illustrates their use on cigarette and marijuana smoking data. Recommendations are provided.
Figures
Similar articles
-
Models for Zero-Inflated and Overdispersed Correlated Count Data: An Application to Cigarette Use.Nicotine Tob Res. 2023 Apr 6;25(5):996-1003. doi: 10.1093/ntr/ntac253. Nicotine Tob Res. 2023. PMID: 36318799 Free PMC article.
-
A comparison of statistical methods for modeling count data with an application to hospital length of stay.BMC Med Res Methodol. 2022 Aug 4;22(1):211. doi: 10.1186/s12874-022-01685-8. BMC Med Res Methodol. 2022. PMID: 35927612 Free PMC article.
-
Multilevel modeling in single-case studies with zero-inflated and overdispersed count data.Behav Res Methods. 2024 Apr;56(4):2765-2781. doi: 10.3758/s13428-024-02359-7. Epub 2024 Feb 21. Behav Res Methods. 2024. PMID: 38383801
-
A comparison of zero-inflated and hurdle models for modeling zero-inflated count data.J Stat Distrib Appl. 2021;8(1):8. doi: 10.1186/s40488-021-00121-4. Epub 2021 Jun 24. J Stat Distrib Appl. 2021. PMID: 34760432 Free PMC article. Review.
-
The selection of statistical models for reporting count outcomes and intervention effects in brief alcohol intervention trials: A review and recommendations.Alcohol Clin Exp Res (Hoboken). 2024 Jan;48(1):16-28. doi: 10.1111/acer.15232. Epub 2023 Dec 6. Alcohol Clin Exp Res (Hoboken). 2024. PMID: 38054529 Free PMC article. Review.
Cited by
-
Effect of COVID-19 pandemic on missed medical appointment among adults with chronic disease conditions in Northwest Ethiopia.PLoS One. 2022 Oct 4;17(10):e0274190. doi: 10.1371/journal.pone.0274190. eCollection 2022. PLoS One. 2022. PMID: 36194566 Free PMC article.
-
Recency of Cannabis Vaping in Sexual Minorities in Wave 5 of the Population Assessment of Tobacco and Health (PATH) Study.Subst Use Misuse. 2024;59(1):136-142. doi: 10.1080/10826084.2023.2262024. Epub 2023 Dec 1. Subst Use Misuse. 2024. PMID: 37750356 Free PMC article.
-
Machine learning approach to predict acute kidney injury among patients undergoing multi-level spinal posterior instrumented fusion.J Spine Surg. 2024 Sep 23;10(3):362-371. doi: 10.21037/jss-24-15. Epub 2024 Aug 23. J Spine Surg. 2024. PMID: 39399076 Free PMC article.
-
An Introduction and Practical Guide to Strategies for Analyzing Longitudinal Data in Clinical Trials of Smoking Cessation Treatment: Beyond Dichotomous Point-Prevalence Outcomes.Nicotine Tob Res. 2024 Jun 21;26(7):796-805. doi: 10.1093/ntr/ntae005. Nicotine Tob Res. 2024. PMID: 38214037 Free PMC article. Review.
-
Determinants of sexually transmitted infections among female sex workers in Ethiopia: a count regression model approach.Front Public Health. 2023 Aug 4;11:1190085. doi: 10.3389/fpubh.2023.1190085. eCollection 2023. Front Public Health. 2023. PMID: 37601188 Free PMC article.
References
-
- Agresti A. An Introduction to Categorical Data Analysis. Hoboken, NJ: Wiley; 2007.
-
- McCullagh P, Nelder JA.. Generalized Linear Models. 2nd ed London: Chapman and Hall; 1989.
-
- Lambert D. Zero-inflated Poisson regression, with an application to defects in manufacturing. Technometrics. 1992;34(1):1–14.
-
- Mullahy J. Specification and testing of some modified count data models. J Econom. 1986;33(3):341–365.
Grants and funding
LinkOut - more resources
Full Text Sources
Other Literature Sources
