. 2018 Jul 27;46(13):e76.
doi: 10.1093/nar/gky255.

Circular permutation profiling by deep sequencing libraries created using transposon mutagenesis

Affiliations

Circular permutation profiling by deep sequencing libraries created using transposon mutagenesis

Joshua T Atkinson et al. Nucleic Acids Res. .

Abstract

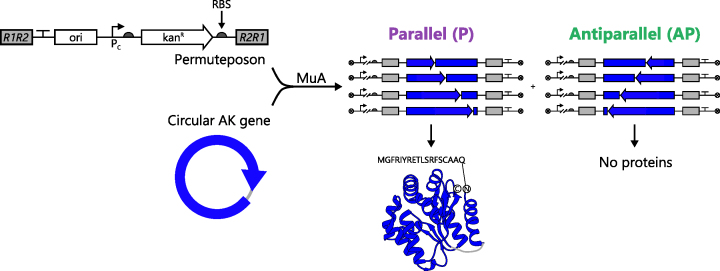
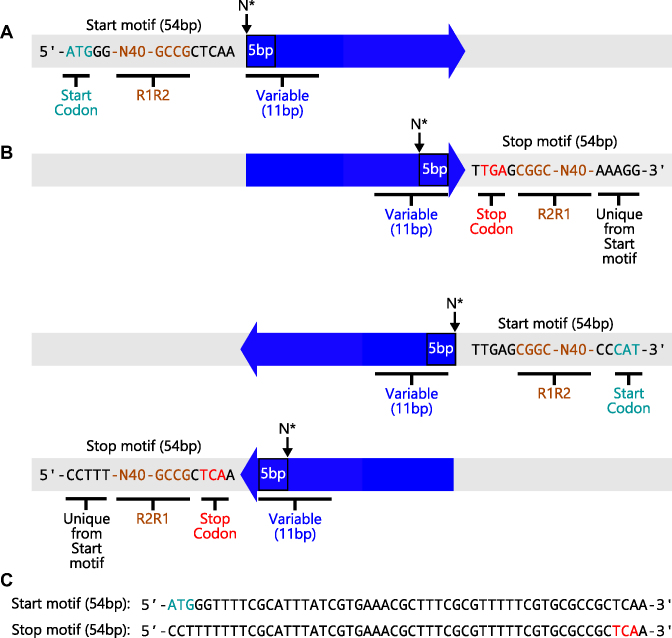
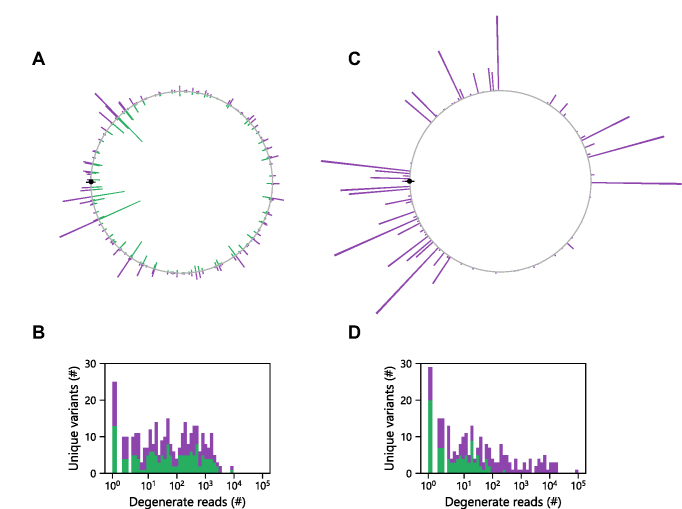
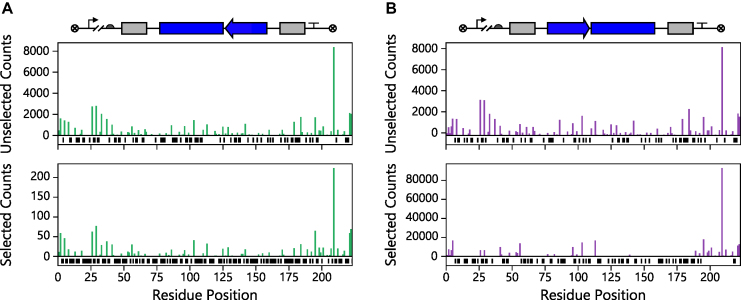
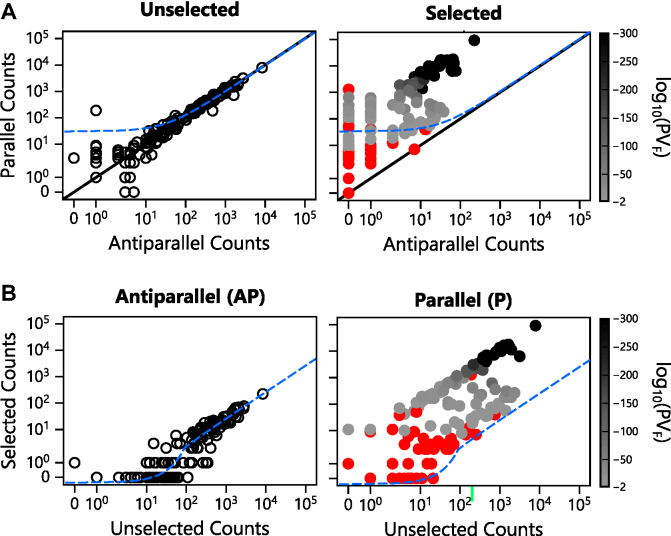
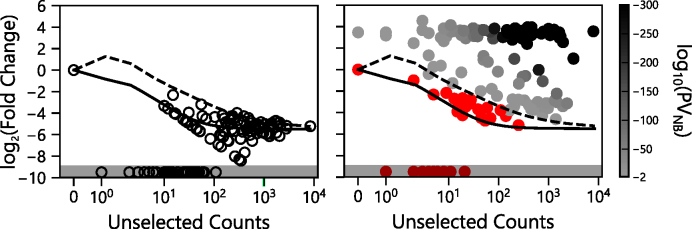
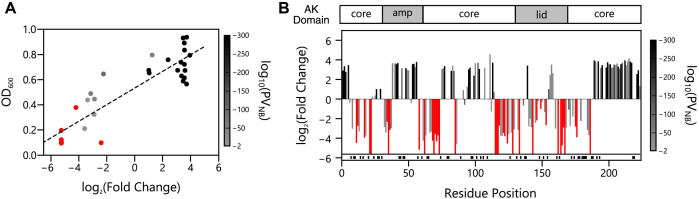
Deep mutational scanning has been used to create high-resolution DNA sequence maps that illustrate the functional consequences of large numbers of point mutations. However, this approach has not yet been applied to libraries of genes created by random circular permutation, an engineering strategy that is used to create open reading frames that express proteins with altered contact order. We describe a new method, termed circular permutation profiling with DNA sequencing (CPP-seq), which combines a one-step transposon mutagenesis protocol for creating libraries with a functional selection, deep sequencing and computational analysis to obtain unbiased insight into a protein's tolerance to circular permutation. Application of this method to an adenylate kinase revealed that CPP-seq creates two types of vectors encoding each circularly permuted gene, which differ in their ability to express proteins. Functional selection of this library revealed that >65% of the sampled vectors that express proteins are enriched relative to those that cannot translate proteins. Mapping enriched sequences onto structure revealed that the mobile AMP binding and rigid core domains display greater tolerance to backbone fragmentation than the mobile lid domain, illustrating how CPP-seq can be used to relate a protein's biophysical characteristics to the retention of activity upon permutation.


Figures

Figure 1.
Figure 1.
A one-step method for constructing libraries. With e-PERMUTE, libraries are created by mixing a circular gene, a permuteposon and MuA. The transposase inserts the permuteposon into the circular gene in two orientations. In the orientation that is designated as parallel, the regulatory elements, i.e. promoter (Pc) and RBS, and the permuted genes are in the same orientation. When an ORF is parallel and in frame, a circularly permuted protein is expressed with an 18-residue peptide amended to the new N-terminus. In the antiparallel orientation, the regulatory elements and the permuted AK genes are in different orientations such that the antisense strand of each permuted gene is transcribed. In this case, the permuted protein cannot be translated.
Figure 2.
Figure 2.
Sequence motifs used to identify the orientation of each AK gene. MiSeq data contained four types of sequence reads for the P variants, including (A) two different types of sense-strand reads and (B) two different types of antisense-strand reads. Reads that occurred at the different ends of permuteposon either contained the start codon (green) or stop codon (red). These were designated Start and Stop motifs. (C) Unique 54 bp sequences were used to differentiate each type of sequence read in our analysis. After identifying whether a sequence read corresponded to the sense versus antisense strand (and Start or Stop motifs), the adjacent 11 bp sequence was compared with all possible 11 bp sequences within both the sense and antisense strands of the circular AK gene. This analysis allowed us to identify the orientation and sequence of the circularly permuted gene in the different sequence reads obtained from MiSeq analysis. The 5 bp sequence directly adjacent to the Start and Stop motifs was used to determine the AK residue at the beginning of each polypeptide.
Figure 3.
Figure 3.
Permuted gene abundances are independent of orientation. (A) The relative abundances of every possible cognate P (purple) and AP (green) variant mapped adjacent to one another on a circle as a function of the distance from the start codon, which is shown as a closed black symbol. Within the unselected library, the relative abundance of identical genes in P and AP orientations is similar. (B) For each unique P (purple) and AP (green) sequence, we evaluated the number of degenerate in frame sequences observed for each variant and plotted these as stacked bars. In the unselected library, 159 of the P variants and 148 of the AP variants were observed in one or more reads of the deep mutational scanning data. (C) Following selection, the relative abundances of every possible gene in the P and AP orientation differed as well as (D) the number of degenerate sequences. Among the selected sequence reads, 144 of the P variants and 85 of the AP variants were observed. Among both the naïve and selected libraries, a total of 171 unique P variants were observed out of 223.
Figure 4.
Figure 4.
Relationship between abundance and the AK codon at the beginning of each permuted genes. A comparison of the number of (A) P and (B) AP sequences before (top) and after selecting (bottom) for biological activity. The residue position represents the AK residue found at the beginning of each ORF regardless of orientation. Only those ORFs encoding in frame variants are shown. In cases where a P or AP variant was absent, black bars are shown below the x-axis.
Figure 5.
Figure 5.
Effect of selection on P and AP sequence abundance. (A) A comparison of the P and AP sequence abundances for each variant in the unselected library (left panel) reveals a linear correlation (y = 0.979x + 30.829; R2 = 0.97), which is shown in blue. Following selection (right panel), the relative abundance of P to AP counts diverged from this trend. The solid black line represents the expectation when cognate P and AP variants occur with identical frequencies. (B) The abundance of each P and AP sequence before (left) and after (right) selection. The AP variants display a linear correlation (y = 0.026x − 0.358; R2 = 0.95), which is shown in blue. Selected P variants are colored as a function of the P-value obtained from Fisher’s Exact Test (PVF), with variants presenting P-values > 0.01 in red, those presenting P-values ≤ 10−300 in black, and those displaying intermediate values shaded as indicated in the bar.
Figure 6.
Figure 6.
Enrichment of parallel sequences following selection. The log2(fold change) in sequence abundances of the AP (open symbols) and P variants (closed symbols). The significance of P variant enrichment obtained using the negative binomial model (PVNB) is colored as a function of the P-value obtained with the variants presenting values >0.01 in red, variants having values ≤10−300 in black and those variants displaying intermediate values shaded as indicated in the bar. The black line represents the mean dilution for AP variants relative to their initial abundance in the unselected library, while the dashed line represents two standard deviations greater than the mean. Variants not observed in the selected library (infinitely diluted) are plotted in the shaded region.
Figure 7.
Figure 7.
Relationship between AK structure and retention of biological activity. (A) For thirty one variants, we compared the log2(fold change) values with growth complementation of Escherichia coli CV2 transformed with vectors that constitutively express each variant. This data displays a linear correlation (y = 0.066x + 0.533; R2 = 0.783). P-values obtained from the negative binomial model (PNB) are color coded and analyzed as described in Figure 6. (B) For each P variant, the log2(fold change) is shown as a function of the AK residue found at the N-terminus of the circularly permuted protein. The AK domain structure is shown as a frame of reference. Variants no longer observed in the selected library (infinitely diluted) are shown as bars that reach the line at the bottom of the graph. Red variants above the shaded region were observed in the selected library but were not significantly enriched (P-values > 0.01). Those cognate P and AP variant pairs absent from both the unselected and selected datasets (n = 52) are indicated as black lines shown below the x-axis.

References

    1. Fowler D.M., Araya C.L., Fleishman S.J., Kellogg E.H., Stephany J.J., Baker D., Fields S.. High-resolution mapping of protein sequence-function relationships. Nat. Methods. 2010; 7:741–746. - PMC - PubMed
    1. Hietpas R.T., Jensen J.D., Bolon D.N.A.. Experimental illumination of a fitness landscape. Proc. Natl. Acad. Sci. U.S.A. 2011; 108:7896–7901. - PMC - PubMed
    1. Fowler D.M., Fields S.. Deep mutational scanning: a new style of protein science. Nat. Methods. 2014; 11:801–807. - PMC - PubMed
    1. Starita L.M., Fields S.. Deep mutational Scanning: a highly parallel method to measure the effects of mutation on protein function. Cold Spring Harb. Protoc. 2015; 2015:711–714. - PubMed
    1. Fowler D.M., Araya C.L., Gerard W., Fields S.. Enrich: software for analysis of protein function by enrichment and depletion of variants. Bioinformatics. 2011; 27:3430–3431. - PMC - PubMed

Publication types

MeSH terms

LinkOut - more resources