. 2018;14(7):1239-1255.
doi: 10.1080/15548627.2018.1474312. Epub 2018 Jul 20.

ROS is the major player in regulating altered autophagy and lifespan in sin-3 mutants of C. elegans

Affiliations

ROS is the major player in regulating altered autophagy and lifespan in sin-3 mutants of C. elegans

Meenakshi Sharma et al. Autophagy. 2018.

Abstract

SIN3, a transcriptional corepressor has been implicated in varied functions both as transcription activator and repressor. Recent studies associated Sin3 with the macroautophagic/autophagic process as a negative regulator of Atg8 and Atg32. Though the role of SIN3 in autophagy is being explored, little is known about the overall effect of SIN3 deletion on the survival of an organism. In this study using a Caenorhabditis elegans sin-3(tm1279);him-5(e1490) strain, we demonstrate that under in vivo conditions SIN-3 differentially modulates autophagy and lifespan. We provide evidence that the enhanced autophagy and decreased lifespan observed in sin-3 deletion mutants is dependent on ROS and intracellular oxidative stress. Inability of the mutant worms to maintain redox balance along with dysregulation of enzymatic antioxidants, depletion of GSH and NADP reserves and elevation of ROS markers compromises the longevity of the worms. It is possible that the enhanced autophagic process observed in sin-3(tm1279);him-5(e1490) worms is required to compensate for oxidative stress generated in these worms.

Abbreviations: cat: catalase; DCFDA: 2',7'-dichlorodihydrofluoroscein diacetate; GSH: reduced glutathione; GSSG: oxidized glutathione; H2O2: hydrogen peroxide; HDAC: Histone deacetylase; HID: HDAC interacting domain; him-5: high incidence of males; HLH-30: Helix Loop Helix-30; HNE: 4-hydroxyl-2-noneal; LIPL: LIPase Like; MDA: malondialdehyde; NGM: nematode growth medium; PAH: paired amphipathic α-helix; PE: phosphatidylethanolamine; RFU: relative fluorescence unit; ROS: reactive oxygen species; sin-3/SIN3: yeast Switch Independent; SOD: superoxide dismutase; NADP: nicotinamide adenine dinucleotide phosphate; SQST-1: SeQueSTosome related-1; ATG: AuTophaGy related.

Keywords: Autophagic flux; C. elegans; ROS; autophagy; lifespan; oxidative stress; sin-3.


Figures

Figure 1.
Figure 1.
Homology between C. elegans SIN-3 and human SIN3A and SIN3B. Multiple sequence alignment showing homology between the different conserved domains of C. elegans SIN-3 and the human orthologs SIN3A and SIN3B isoforms. T-coffee multiple sequence alignment tool of EMBL-EBI was used (Red boxes depicts conserved sequences and yellow boxes depict similar sequences). a.a., amino acids.
Figure 2.
Figure 2.
Transient knockdown of sin-3 leads to increased autophagy and reduced lifespan. Representative images of GFP::LGG-1 expression in the seam cells of L3 larvae (A) GFP::LGG-1 transgenic worms, (B) accumulation of GFP-positive puncta in GFP::LGG-1 transgenic worms fed on sin-3 RNAi at 1000X. (C) Quantification of GFP::LGG-1-positive puncta in seam cells of GFP::LGG-1 transgenic and sin-3 RNAi fed GFP::LGG-1 transgenic worms (D) Kaplan-Meier survival curve showing reduction in the lifespan of N2 worms fed on bacteria expressing dsRNAi against sin-3 (solid line depicts control vector L4440 fed and dotted line represents sin-3 RNAi fed N2 worms). The arrows show representative GFP-positive puncta that label phagophores and autophagosomal structures. *** P ≤ 0.0001, between vector alone and sin-3 RNAi fed GFP::LGG-1 transgenic worms. Scale: 500 µm. GFP::LGG-1 transgenic worms have genotype adIs2122[Plgg-1::GFP::LGG-1;rol-6(su1006)]. Twenty worms were analyzed per treatment and the experiment was repeated 3 times.
Figure 3.
Figure 3.
Transient knockdown of sin-3 causes increased autophagic flux but no autophagy-dependent change in lifespan. Kaplan-Meier survival curve showing the lifespan of (A) him-5(e1490) worms and (B) sin-3(tm1279);him-5(e1490) worms fed either control bacteria or bacteria expressing bec-1 or atg-7 dsRNA. No significant difference is observed upon treatment. Representative images of SQST-1::GFP expression in the lateral intestine of (C) sqst-1::GFP;him-5(e1490)worms fed on bacteria expressing empty vector control (left panel) or bacteria expressing dsRNA against sin-3 (right panel) at young adult stage. (D) Quantification of SQST-1::GFP-positive puncta in the lateral intestine of worms fed either control or sin-3 RNAi expressing bacteria. ***P ≤ 0.001 for sin-3 RNAi treatments compared to control vector L4440. 20 worms were analyzed per condition and the experiment was repeated 3 times. Scale bar: 500 µm.
Figure 4.
Figure 4.
Expression of ROS-mediated genes and intracellular ROS is upregulated in sin-3;him-5 worms. (A) Quantitative RT-PCR was performed using cDNA prepared from N2, him-5(e1490) and sin-3(tm1279);him-5(e1490) worms as a template and primer pairs for the genes indicated along the X-axis. Fold change in the gene expression relative to him-5(e1490) isogenic control is indicated (ns, non-significant; **P < 0.05; ****P < 0.001 and denotes the comparison with respect to him-5(e1490); two-way ANOVA performed). (B) Relative fluorescence units as a measure of ROS were measured in N2 and various mutant worms as described in Materials and Methods, were measured with a microplate fluorescence reader Tecan M1000. (C) Relative fluorescence as compared to the control him-5(e1490). Where, N2: wild-type, sin-3;him-5: sin-3(tm1279);him-5(e1490) mutant, him-5(e1490): isogenic control, daf-16(mu86) and daf-2(e1370) are short lived and long lived mutants (ns, non-significant; **P < 0.05; ****P < 0.001 and denotes the comparison with respect to him-5 [e1490]; one way ANOVA performed).
Figure 5.
Figure 5.
Confocal images of in vivo DCFDA-stained worms. The fluorescence in the pharynx and overall body of the sin-3;him-5 mutant worm (B) is considerably higher than the wild-type N2 (A), him-5(e1490) isogenic control (D) and short lived mutant daf-16(mu86) (F) worms. The high intracellular fluorescence is restored to basal levels after the sin-3;him-5 worms (C) were grown on NGM plates supplemented with 10 mM vitamin C. No significant difference is observed between him-5(e1490) worms grown on NGM plates with (E) and without vitamin C supplementation (D). 20 worms per strain were photographed and the experiment was repeated 3 times. Images were taken at 200X; scale: 20 µm.
Figure 6.
Figure 6.
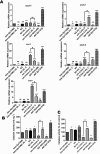
Expression of SOD genes and catalase activity is differentially altered in sin-3;him-5 worms. (A) Quantitative RT-PCR was performed using cDNA prepared from various worm strains indicated along X-axis as template and primer pairs for the genes indicated on top. Fold change in the gene expression w.r.t him-5(e1490) is indicated. (B) Enzymatic activity of catalase depicted as catalase activity in mKmg−1 and (C) catalase activity as percentage of control. N2, wild-type; sin-3;him-5, sin-3(tm1279);him-5(e1490) mutant; sin-3;him-5 Vit. C, sin-3(tm1279);him-5(e1490); him-5(e1490) Vit. C, him-5(e1490) worms maintained on NGM plates supplemented with 10 mM vitamin C. Other mutants are duly indicated on the graph (ns, non-significant; **P < 0.05; ****P < 0.001 and denotes the comparison with respect to him-5[e1490]; one way ANOVA performed, #P < 0.05 and denotes the comparison between sin-3;him-5 and vitamin C-supplemented sin-3;him-5 worms; Student’s paired t test performed).
Figure 7.
Figure 7.
sin-3;him-5 worms have elevated lipid peroxidation levels. (A) Lipid peroxidation levels as measured through 2-phenyl, 2-vinylindole detection of malondialdehyde in various C. elegans strains. (B) Malondialdehyde concentration as percentage of control. N2, wild-type; sin-3;him-5: sin-3(tm1279);him-5(e1490) mutant; sin-3;him-5 Vit. C, sin-3(tm1279);him-5(e1490); him-5(e1490) Vit. C, him-5(e1490) worms maintained on NGM plates supplemented with 10 mM vitamin C. Other mutants are duly indicated on the graph (ns, non-significant; **P < 0.05; ****P < 0.001 and denotes the comparison with respect to him-5 [e1490]; one way ANOVA performed, #P < 0.001 and denotes the comparison between sin-3;him-5 and vitamin C-supplemented sin-3;him-5 worms; paired Student’s t test performed). All experiments were repeated 3 times.
Figure 8.
Figure 8.
Altered redox NADP and glutathione status in sin-3;him-5 worms. (A) Total NADP content in various C. elegans strains in pmole/ml of lysate. (B) Ratio of NADP:NADPH in various strains (C) Total glutathione content in various C. elegans strains in nmole/mg protein. (D) Ratio of GSH:GSSG in different strains. Where N2, wild-type; sin-3;him-5, sin-3(tm1279);him-5(e1490) mutant; sin-3;him-5 Vit. C, sin-3(tm1279);him-5(e1490); him-5(e1490) Vit. C, him-5(e1490) worms maintained on NGM plate supplemented with 10 mM vitamin C. Other mutants are duly indicated on the graph (ns, non-significant; **P < 0.05; ****< 0.001 and denotes the comparison with respect to him-5[e1490]; one way ANOVA performed, #P < 0.001 and denotes the comparison between sin-3;him-5 and vitamin C-supplemented sin-3;him-5 worms; paired Student’s t test performed). Each experiment was repeated 3 times.
Figure 9.
Figure 9.
Altered lifespan and autophagy are rescued by supplementation of vitamin C in the background of sin-3 deletion. Kaplan-Meier survival curve showing the lifespan of (A) him-5(e1490) (solid line), him-5 (e1490) isogenic control worms maintained on NGM plates supplemented with vitamin C (dotted line); (B) sin-3(tm1279);him-5(e1490) (solid line), sin-3(tm1279);him-5(e1490) worms maintained on NGM plates supplemented with vitamin C (dotted line). (*P ≤ 0.0001, between sin-3(tm1279);him-5(e1490) worms maintained on normal NGM plates or NGM plates containing 10 mM vitamin C. (C) Representative images of GFP::LGG-1 expression in the intestine of L3 larvae in adIs2122(Plgg-1::GFP::LGG-1;rol-6[su1006]) (denoted as GFP::LGG-1) worms fed on bacteria expressing dsRNA against sin-3 grown either on normal NGM plates (left panel) or (D) NGM plates containing 10 mM vitamin C (right panel). (E) Relative mRNA expression levels of atf-5 in GFP::LGG-1 and (F) GFP::SQST-1 transgenic worms when grown on either NGM or NGM plates supplemented with 10 mM vitamin C and fed either bacteria expressing sin-3 RNAi or control vector. (G) Levels of GFP protein tagged with LGG-1 and the lipidated GFP::LGG-1-PE in worms fed on bacteria expressing control RNAi and sin-3 RNAi and grown either on NGM or NGM supplemented with 10 mM vitamin C were examined by western blot. Actin was used as loading control. (H) Densitometric quantification of the band intensity using ImageJ software. (****< 0.0001, one-way ANOVA performed). Images were acquired at 1000X, 20 animals per treatment were visualized and the experiment was repeated 3 times. Scale: 500 µm.

Similar articles

Cited by

References

    1. Kuo MH, Allis CD.. Roles of histone acetyltransferases and deacetylases in gene regulation. Bioessays. 1998. August;20(8):615–626. PubMed PMID: 9780836; eng. - PubMed
    1. Silverstein RA, Ekwall K.. Sin3: a flexible regulator of global gene expression and genome stability. Curr Genet. 2005. January;47(1):1–17. PubMed PMID: 15565322; eng. - PubMed
    1. Bernstein BE, Tong JK, Schreiber SL. Genomewide studies of histone deacetylase function in yeast. Proc Natl Acad Sci U S A. 2000. December 5;97(25):13708–13713. PubMed PMID: 11095743; PubMed Central PMCID: PMCPmc17640. eng. - PMC - PubMed
    1. Fazzio TG, Kooperberg C, Goldmark JP, et al. Widespread collaboration of Isw2 and Sin3-Rpd3 chromatin remodeling complexes in transcriptional repression. Mol Cell Biol. 2001. October;21(19):6450–6460. PubMed PMID: 11533234; PubMed Central PMCID: PMCPmc99792. eng. - PMC - PubMed
    1. Pile LA, Spellman PT, Katzenberger RJ, et al. The SIN3 deacetylase complex represses genes encoding mitochondrial proteins: implications for the regulation of energy metabolism. J Biol Chem. 2003. September 26;278(39):37840–37848. PubMed PMID: 12865422; eng. - PubMed

Publication types

MeSH terms