Intracochlear Pressures in Simulated Otitis Media With Effusion: A Temporal Bone Study
- PMID: 29912830
- PMCID: PMC6041178
- DOI: 10.1097/MAO.0000000000001869
Intracochlear Pressures in Simulated Otitis Media With Effusion: A Temporal Bone Study
Abstract
Hypothesis: Simulated otitis media with effusion reduces intracochlear pressures comparable to umbo velocity.
Background: Otitis media with effusion is a common cause of temporary hearing loss, particularly in children, producing deficits of 30 to 40 dB. Previous studies measured the effects of simulated effusion on ossicular mechanics; however, no studies have measured cochlear stimulation directly. Here, we compare pressures in the scala vestibuli and tympani to umbo velocity, before and after induction of simulated effusion in cadaveric human specimens.
Methods: Eight cadaveric, hemi-cephalic human heads were prepared with complete mastoidectomies. Intracochlear pressures were measured with fiber optic pressure probes, and umbo velocity measured via laser Doppler vibrometry (LDV). Stimuli were pure tones (0.1-14 kHz) presented in the ear canal via a custom speculum sealed with a glass cover slip. Effusion was simulated by filling the mastoid cavity and middle ear space with water.
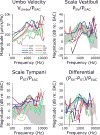
Results: Acoustic stimulation with middle ear effusion resulted in decreased umbo velocity up to ∼26 dB, whereas differential pressure (PDiff) at the base of the cochlea decreased by only ∼16 dB.
Conclusion: Simulating effusion leads to a frequency-dependent reduction in intracochlear sound pressure levels consistent with audiological presentation and prior reports. Results reveal that intracochlear pressure measurements (PSV and PST) decrease less than expected, and less than the decrease in PDiff. The observed decrease in umbo velocity is greater than in the differential intracochlear pressures, suggesting that umbo velocity overestimates the induced conductive hearing loss. These results suggest that an alternate sound conduction pathway transmits sound to the inner ear during effusion.
Conflict of interest statement
None.
Figures


Similar articles
-
Stapes displacement and intracochlear pressure in response to very high level, low frequency sounds.Hear Res. 2017 May;348:16-30. doi: 10.1016/j.heares.2017.02.002. Epub 2017 Feb 9. Hear Res. 2017. PMID: 28189837 Free PMC article.
-
Conductive hearing loss induced by experimental middle-ear effusion in a chinchilla model reveals impaired tympanic membrane-coupled ossicular chain movement.J Assoc Res Otolaryngol. 2013 Aug;14(4):451-64. doi: 10.1007/s10162-013-0388-x. Epub 2013 Apr 25. J Assoc Res Otolaryngol. 2013. PMID: 23615802 Free PMC article.
-
Intracochlear pressure measurements during acoustic shock wave exposure.Hear Res. 2018 Aug;365:149-164. doi: 10.1016/j.heares.2018.05.014. Epub 2018 May 19. Hear Res. 2018. PMID: 29843947 Free PMC article.
-
Intracochlear pressure in cadaver heads under bone conduction and intracranial fluid stimulation.Hear Res. 2022 Aug;421:108506. doi: 10.1016/j.heares.2022.108506. Epub 2022 Apr 12. Hear Res. 2022. PMID: 35459531 Review.
-
Lumped element models of sound conduction in the human ear: A systematic review.J Acoust Soc Am. 2023 Sep 1;154(3):1696-1709. doi: 10.1121/10.0020841. J Acoust Soc Am. 2023. PMID: 37712750
Cited by
-
Characterizing Insertion Pressure Profiles During Cochlear Implantation: Simultaneous Fluoroscopy and Intracochlear Pressure Measurements.Otol Neurotol. 2020 Jan;41(1):e46-e54. doi: 10.1097/MAO.0000000000002437. Otol Neurotol. 2020. PMID: 31613835 Free PMC article.
-
Methods and reference data for middle ear transfer functions.Sci Rep. 2022 Oct 14;12(1):17241. doi: 10.1038/s41598-022-21245-w. Sci Rep. 2022. PMID: 36241675 Free PMC article.
-
A Comparison of Intracochlear Pressures During Ipsilateral and Contralateral Stimulation With a Bone Conduction Implant.Ear Hear. 2020 Mar/Apr;41(2):312-322. doi: 10.1097/AUD.0000000000000758. Ear Hear. 2020. PMID: 31389846 Free PMC article.
-
Risks of Intracochlear Pressures From Laser Stapedotomy.Otol Neurotol. 2020 Mar;41(3):308-317. doi: 10.1097/MAO.0000000000002499. Otol Neurotol. 2020. PMID: 31746814 Free PMC article.
References
-
- Black NA. Is glue ear a modern phenomenon? A historical review of the medical literature. Clin Otolaryngol Allied Sci. 1984;9:155–63. - PubMed
-
- Paparela M, Jung T, Goycoolea M. Otitis Media with Effusion: Paparella and Shumrich-Otolaryngology. London, Saunders. 1990;2:1317–42.
-
- Rovers MM, Schilder AG, Zielhuis GA, et al. Otitis media. Lancet. 2004;363:465–73. - PubMed
-
- Finkelstein Y, Ophir D, Talmi YP, et al. Adult-onset otitis media with effusion. Arch Otolaryngol Head Neck Surg. 1994;120:517–27. - PubMed
-
- Black N. Causes of glue ear. An historical review of theories and evidence. J Laryngol Otol. 1985;99:953–66. - PubMed
Publication types
MeSH terms
Grants and funding
LinkOut - more resources
Full Text Sources
Other Literature Sources
Miscellaneous

