

Hepatitis C virus notification rates in Australia are highest in socioeconomically disadvantaged areas
- PMID: 29912897
- PMCID: PMC6005510
- DOI: 10.1371/journal.pone.0198336
Hepatitis C virus notification rates in Australia are highest in socioeconomically disadvantaged areas
Abstract
Background: Poor access to health services is a significant barrier to achieving the World Health Organization's hepatitis C virus (HCV) elimination targets. We demonstrate how geospatial analysis can be performed with commonly available data to identify areas with the greatest unmet demand for HCV services.
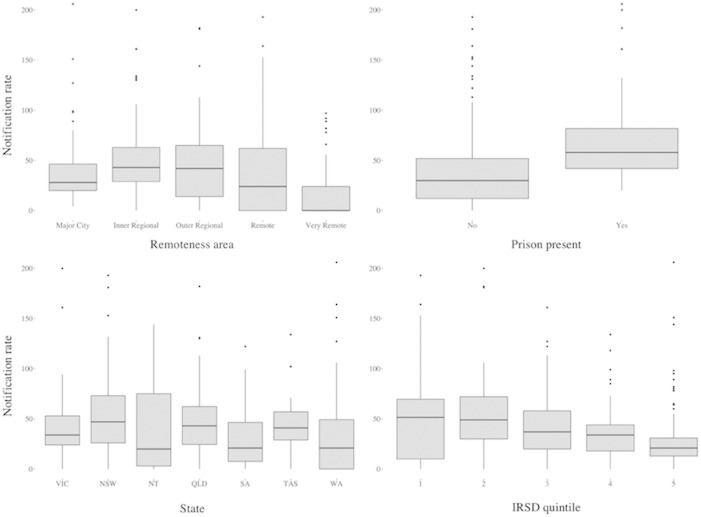
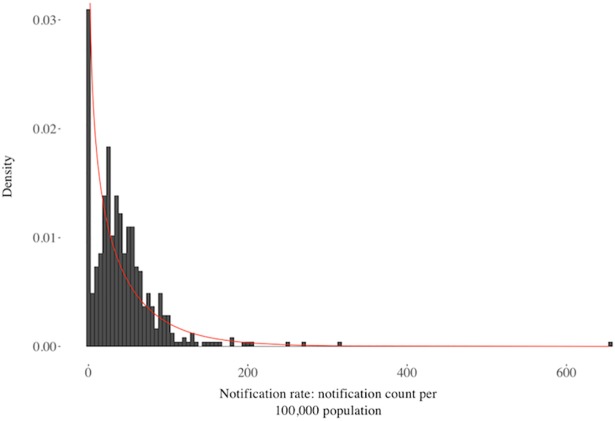
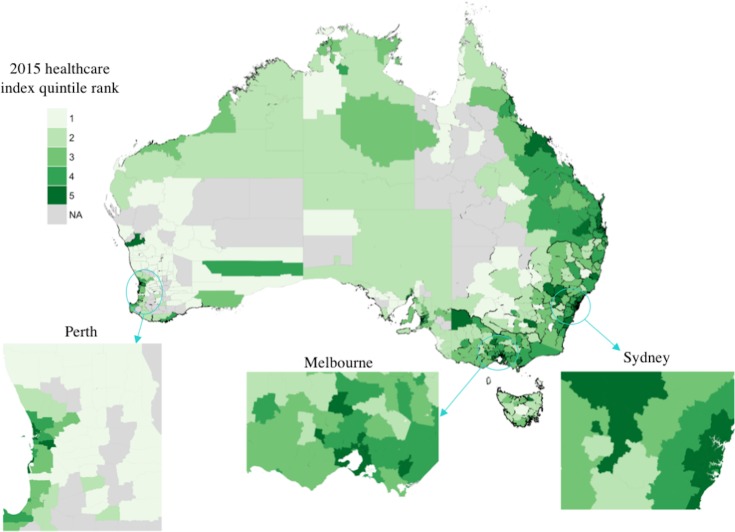
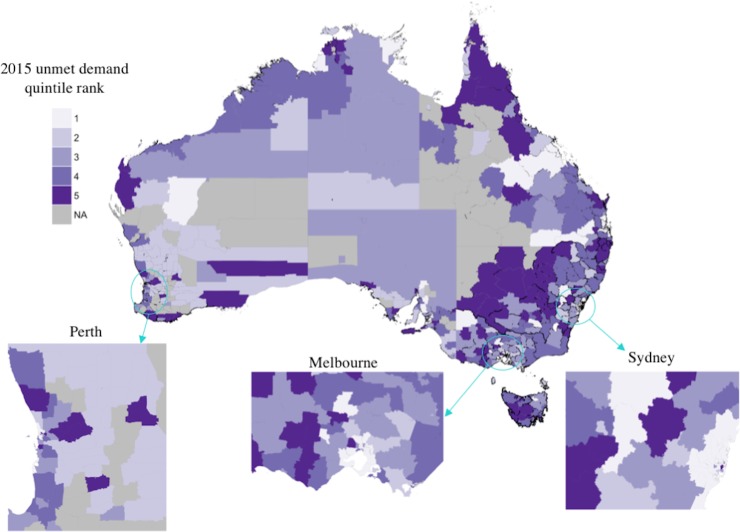
Methods: We performed an Australia-wide cross-sectional analysis of 2015 HCV notification rates using local government areas (LGAs) as our unit of analysis. A zero-inflated negative binomial regression was used to determine associations between notification rates and socioeconomic/demographic factors, health service and geographic remoteness area (RA) classification variables. Additionally, component scores were extracted from a principal component analysis (PCA) of the healthcare service variables to provide rankings of relative service coverage and unmet demand across Australia.
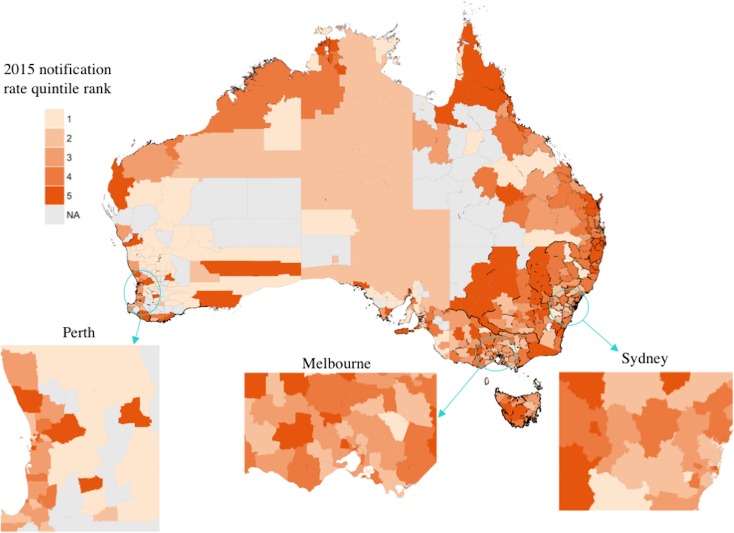
Results: Among LGAs with non-zero notifications, higher rates were associated with areas that had increased socioeconomic disadvantage, more needle and syringe services (incidence rate ratio [IRR] 1.022; 95%CI 1.001, 1.044) and more alcohol and other drug services (IRR 1.019; 1.005, 1.034). The distribution of PCA component scores indicated that per-capita healthcare service coverage was lower in areas outside of major Australian cities. Areas outside of major cities also contained 94% of LGAs in the lowest two socioeconomic quintiles, as well as 35% of HCV notifications despite only representing 29% of the population.
Conclusions: As countries aim for HCV elimination, routinely collected data can be used to identify geographical areas for priority service delivery. In Australia, the unmet demand for HCV treatment services is greatest in socioeconomically disadvantaged and non-metropolitan areas.
Conflict of interest statement
The authors have declared that no competing interests exist.
Figures
Similar articles
-
Insights into the spatial epidemiology of hepatitis C infection: systematic synthesis of area-level determinants and spatiotemporal analyses.BMC Public Health. 2025 Feb 19;25(1):687. doi: 10.1186/s12889-025-21668-w. BMC Public Health. 2025. PMID: 39972312 Free PMC article.
-
Sociodemographic and geographical inequalities in notifiable infectious diseases in Australia: a retrospective analysis of 21 years of national disease surveillance data.Lancet Infect Dis. 2017 Jan;17(1):86-97. doi: 10.1016/S1473-3099(16)30309-7. Epub 2016 Oct 24. Lancet Infect Dis. 2017. PMID: 27789179
-
The epidemiology of hepatitis C in Australia: notifications, treatment uptake and liver transplantations, 1997-2006.J Gastroenterol Hepatol. 2009 Oct;24(10):1648-54. doi: 10.1111/j.1440-1746.2009.05910.x. J Gastroenterol Hepatol. 2009. PMID: 19798783
-
The distribution and socioeconomic burden of Hepatitis C virus in South Australia: a cross-sectional study 2010-2016.BMC Public Health. 2019 May 8;19(1):527. doi: 10.1186/s12889-019-6847-5. BMC Public Health. 2019. Retraction in: BMC Public Health. 2021 Jun 02;21(1):1049. doi: 10.1186/s12889-021-10978-4. PMID: 31068170 Free PMC article. Retracted.
-
Hepatitis C prevalence--a nationwide serosurvey.Commun Dis Intell Q Rep. 2004;28(4):517-21. doi: 10.33321/cdi.2004.28.60. Commun Dis Intell Q Rep. 2004. PMID: 15745402
Cited by
-
Heterogeneity in hepatitis C treatment prescribing and uptake in Australia: a geospatial analysis of a year of unrestricted treatment access.J Virus Erad. 2018 Apr 1;4(2):108-114. doi: 10.1016/S2055-6640(20)30253-3. J Virus Erad. 2018. PMID: 29682303 Free PMC article.
-
Insights into the spatial epidemiology of hepatitis C infection: systematic synthesis of area-level determinants and spatiotemporal analyses.BMC Public Health. 2025 Feb 19;25(1):687. doi: 10.1186/s12889-025-21668-w. BMC Public Health. 2025. PMID: 39972312 Free PMC article.
-
Cost-effectiveness analysis of an outreach model of Hepatitis C Virus (HCV) assessment to facilitate HCV treatment in primary care.PLoS One. 2020 Jun 17;15(6):e0234577. doi: 10.1371/journal.pone.0234577. eCollection 2020. PLoS One. 2020. PMID: 32555696 Free PMC article.
References
-
- World Health Organisation. Draft global health sector strategy on viral hepatitis, 2016–2021—the first of its kind 2015. Available from: http://www.who.int/hepatitis/news-events/strategy2016-2021/en/.
-
- Thompson A. Australian recommendations for the management of hepatitis C virus infection: a consensus statement. The Medical Journal of Australia 2016;204: 268–72. - PubMed
-
- Hepatitis C Virus Infection Consensus Statement Working Group. Australian recommendations for the management of hepatitis C virus infection: a consensus statement: Melbourne Gastroenterological Society of Australia; 2016. Available from: https://wwwasidnetau/documents/item/1208.
-
- Australian Government Department of Health. 2015. Available from: https://www.health.gov.au/internet/ministers/publishing.nsf/Content/heal....
-
- Nelson PK, Bradley MM, Cowie B, Hogan H, Jarlais DD, Horyniak D, et al. Global epidemiology of hepatitis B and hepatitis C in people who inject drugs: results of systematic reviews. The Lancet. 2011;378(9791):571–83. doi: 10.1016/S0140-6736(11)61097-0 - DOI - PMC - PubMed
Publication types
MeSH terms
LinkOut - more resources
Full Text Sources
Other Literature Sources
Medical
Research Materials
