

Zoonoses under our noses
- PMID: 29913297
- PMCID: PMC6386771
- DOI: 10.1016/j.micinf.2018.06.001
Zoonoses under our noses
Abstract
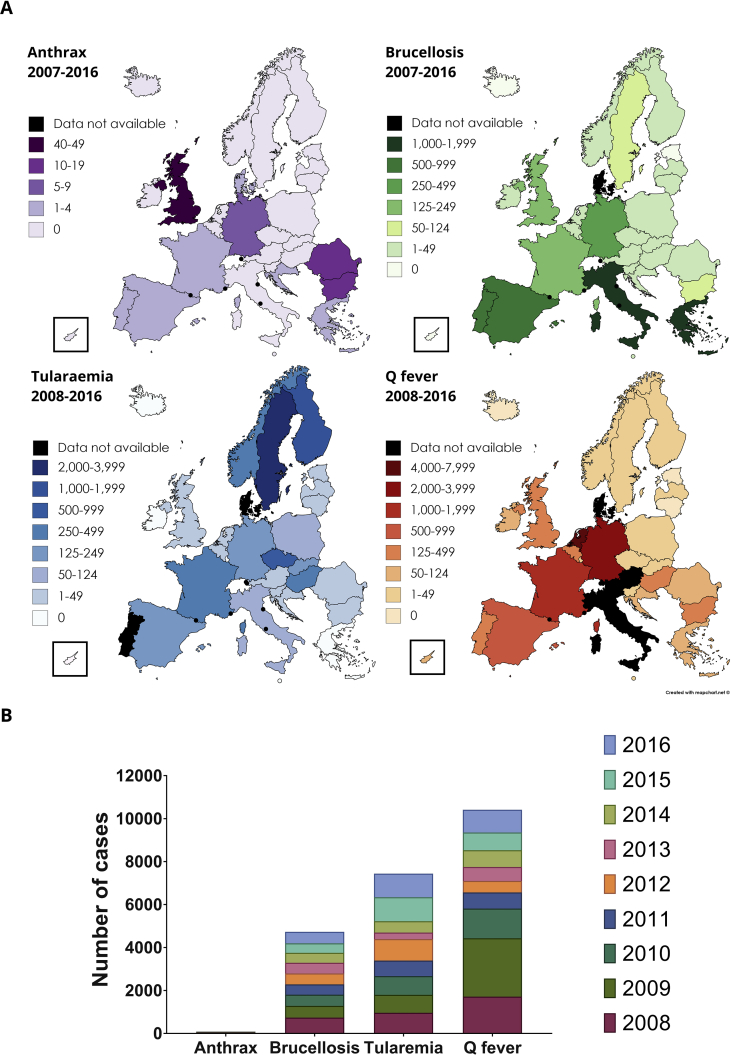
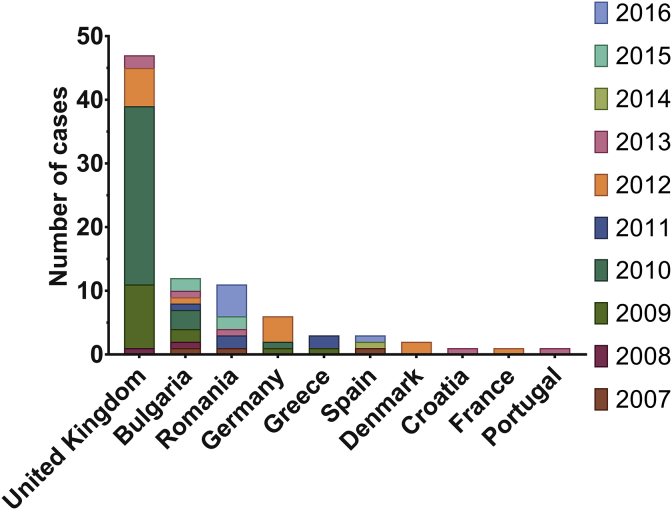
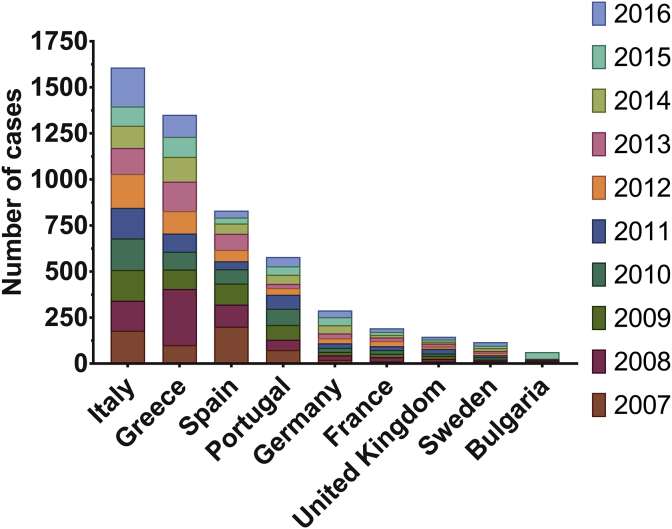
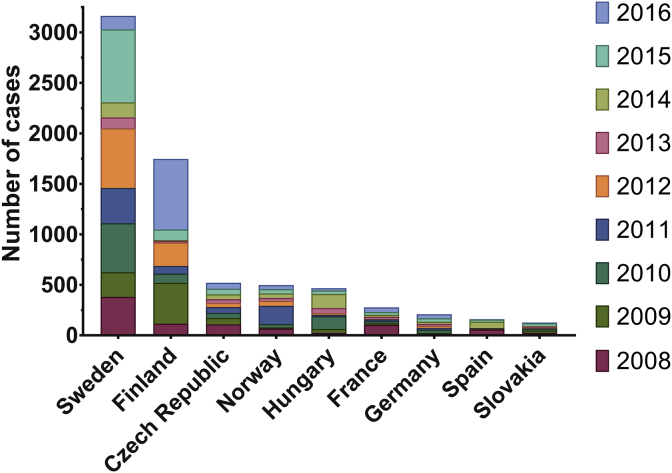
One Health is an effective approach for the management of zoonotic disease in humans, animals and environments. Examples of the management of bacterial zoonoses in Europe and across the globe demonstrate that One Health approaches of international surveillance, information-sharing and appropriate intervention methods are required to successfully prevent and control disease outbreaks in both endemic and non-endemic regions. Additionally, a One Health approach enables effective preparation and response to bioterrorism threats.
Keywords: Anthrax; Brucella; Brucellosis; Coxiella; Q fever; Tularaemia.
Crown Copyright © 2018. Published by Elsevier Masson SAS. All rights reserved.
Figures
Similar articles
-
Zoonotic risks from small ruminants.Vet Microbiol. 2015 Dec 14;181(1-2):53-65. doi: 10.1016/j.vetmic.2015.07.015. Epub 2015 Jul 15. Vet Microbiol. 2015. PMID: 26275853 Review.
-
[Bacterial zoonoses: emerging concepts].Bull Acad Natl Med. 2006 Mar;190(3):579-94; discussion 595, 625-7. Bull Acad Natl Med. 2006. PMID: 17140097 Review. French.
-
Assessing and Prioritizing Zoonotic Diseases in Punjab, India: A One Health Approach.Ecohealth. 2023 Sep;20(3):300-322. doi: 10.1007/s10393-023-01654-7. Epub 2023 Nov 21. Ecohealth. 2023. PMID: 37989991
-
[Current epidemiology of selected bacterial zoonoses].Gesundheitswesen. 2004 Feb;66 Suppl 1:S26-30. doi: 10.1055/s-2004-812761. Gesundheitswesen. 2004. PMID: 14770334 German.
-
Successes and challenges of the One Health approach in Kenya over the last decade.BMC Public Health. 2019 May 10;19(Suppl 3):465. doi: 10.1186/s12889-019-6772-7. BMC Public Health. 2019. PMID: 32326940 Free PMC article.
Cited by
-
Estimates of the Economic Cost Caused by Five Major Reproductive Problems in Dairy Animals in Assam and Bihar, India.Animals (Basel). 2021 Oct 30;11(11):3116. doi: 10.3390/ani11113116. Animals (Basel). 2021. PMID: 34827848 Free PMC article.
-
A Cross-Sectional Study of Knowledge on Ownership, Zoonoses and Practices among Pet Owners in Northern Portugal.Animals (Basel). 2021 Dec 13;11(12):3543. doi: 10.3390/ani11123543. Animals (Basel). 2021. PMID: 34944317 Free PMC article.
-
Is clinical primary care surveillance for tularaemia a useful addition to laboratory surveillance? An analysis of notification data for Finland, 2013 to 2019.Euro Surveill. 2022 Jan;27(4):2100098. doi: 10.2807/1560-7917.ES.2022.27.4.2100098. Euro Surveill. 2022. PMID: 35086610 Free PMC article.
-
Comparison of Long-Term Antibody Titers in Calves Treated with Different Conjunctival and Subcutaneous Brucella abortus S19 Vaccines.Animals (Basel). 2025 Jan 14;15(2):212. doi: 10.3390/ani15020212. Animals (Basel). 2025. PMID: 39858212 Free PMC article.
-
DNA Sensor for the Detection of Brucella spp. Based on Magnetic Nanoparticle Markers.Int J Mol Sci. 2023 Dec 8;24(24):17272. doi: 10.3390/ijms242417272. Int J Mol Sci. 2023. PMID: 38139102 Free PMC article.
References
-
- CDC . 20/02/2018. One health.https://www.cdc.gov/onehealth/
-
- Morand S., McIntyre K.M., Baylis M. Domesticated animals and human infectious diseases of zoonotic origins: domestication time matters. Infect Genet Evol. 2014;24:76–81. - PubMed
-
- FAO/OIE/WHO . 15–17 November 2011. High-level technical meeting to address health risks at the human-animal ecosystems interfaces: Mexico city, Mexico.
-
- Gebreyes W.A., Dupouy-Camet J., Newport M.J., Oliveira C.J., Schlesinger L.S., Saif Y.M. The global one health paradigm: challenges and opportunities for tackling infectious diseases at the human, animal, and environment interface in low-resource settings. PLoS Neglected Trop Dis. 2014;8:e3257. - PMC - PubMed
-
- WHO . 2015. The control of neglected zoonotic diseases: from advocacy to action: report of the fourth international meeting held at WHO headquarters, Geneva, Switzerland. Geneva; p. 44.
Publication types
MeSH terms
Grants and funding
LinkOut - more resources
Full Text Sources
Other Literature Sources
Medical
