. 2018;64(2):417-435.
doi: 10.3233/JAD-180173.

A Study of Amyloid-β and Phosphotau in Plaques and Neurons in the Hippocampus of Alzheimer's Disease Patients

Affiliations

A Study of Amyloid-β and Phosphotau in Plaques and Neurons in the Hippocampus of Alzheimer's Disease Patients

Diana Furcila et al. J Alzheimers Dis. 2018.

Abstract

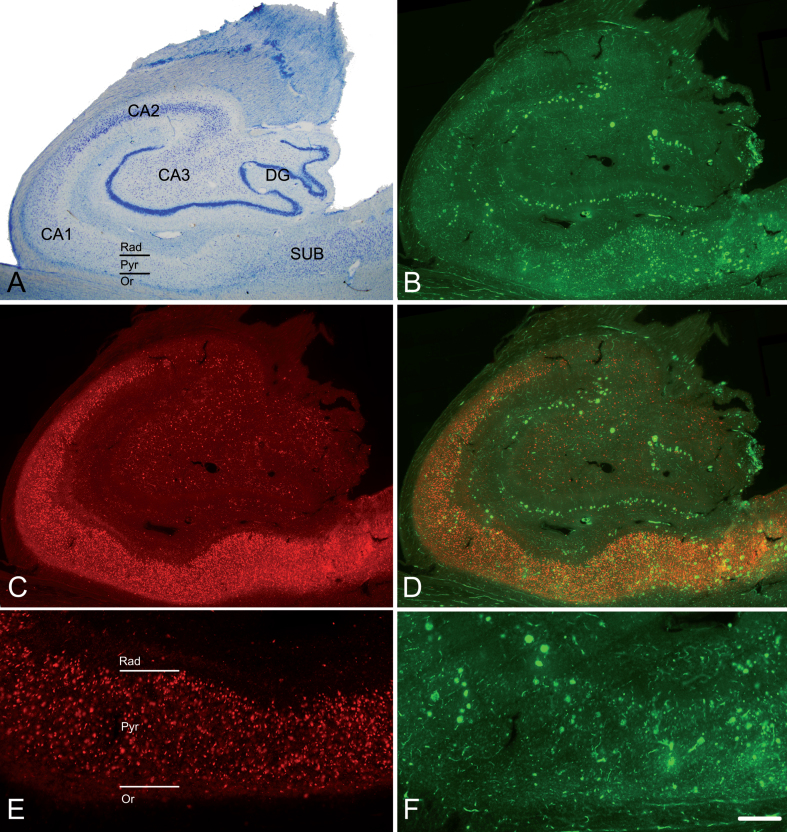
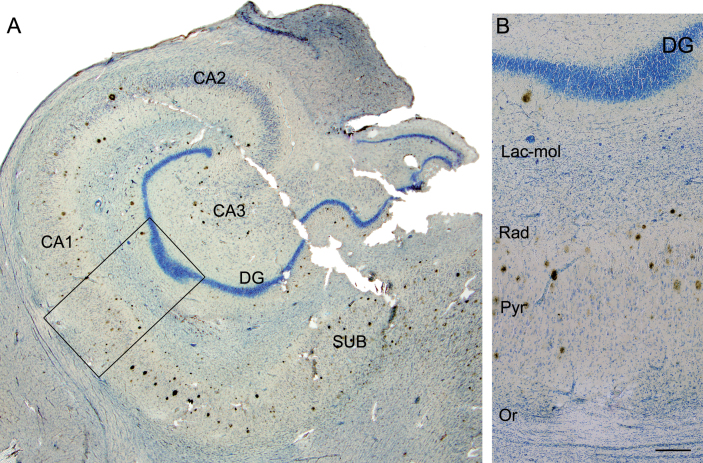
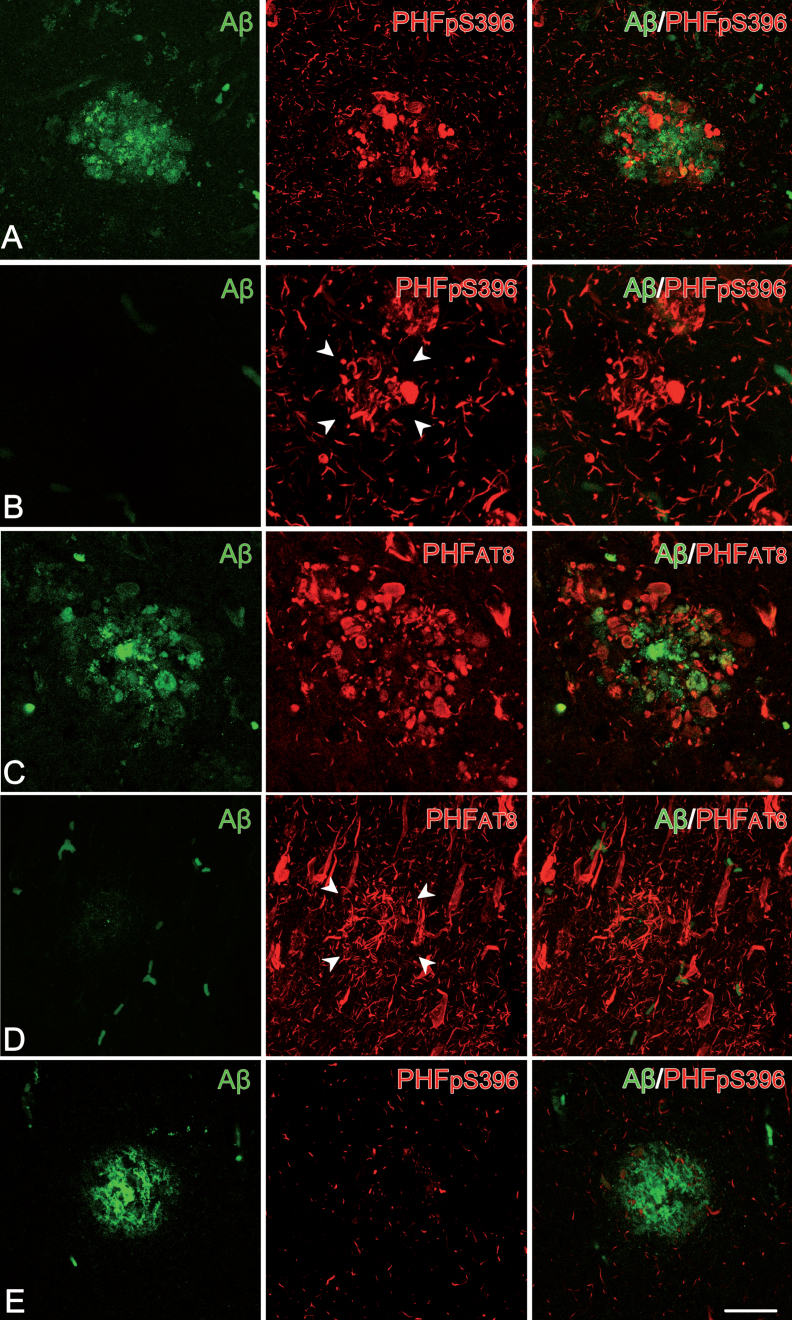
The main pathological hallmarks in Alzheimer's disease (AD) are the presence of extracellular amyloid plaques, primarily consisting of amyloid-β (Aβ) peptide, and the accumulation of paired helical filaments of hyperphosphorylated tau protein (PHF-Tau) within neurons. Since CA1 is one of the most affected regions in AD, mainly at early stages, we have performed a detailed analysis of the CA1 region from 11 AD patients (demented and clinically similar; Braak stages IV-VI) to better understand the possible relationship between the presence and distribution of different neurochemical types of Aβ plaques and PHF-Tau immunoreactive (- ir) neurons. Hence, we have examined hippocampal sections in confocal microscopy images from double and triple-immunostained sections, to study labeled plaques and PHF-Tau-ir neurons using specific software tools. There are four main findings in the present study. First, the pyramidal layer of proximal CA1 (close to CA2) contains the smallest number of both plaques and PHF-Tau-ir neurons. Second, a large proportion of Aβ-ir plaques were also characterized by the presence of PHF-Tau-ir. Third, all plaques containing one of the two PHF-Tau isoforms also express the other isoform, that is, if a plaque contains PHFpS396, it also contains PHFAT8, and vice versa. Fourth, the coexpression study of both PHF-Tau isoforms in CA1 neurons revealed that most of the labeled neurons express only PHFpS396. Our findings further support the idea that AD is not a unique entity even within the same neuropathological stage, since the microanatomical/neurochemical changes that occur in the hippocampus greatly vary from one patient to another.

Keywords: Confocal microscopy; hippocampal CA1 field; immunofluorescence; methoxy-X04; neurofibrillary tangles; senile plaques; tau protein.


Figures

Fig. 1
Fig. 1
The hippocampal formation from an AD patient. A) Nissl-stained section from an AD patient (Az6) to illustrate the hippocampal fields. Note the neuronal loss in CA1. B) Confocal images showing immunostaining for anti-Aβ and C) anti-PHFpS396, taken from a double-immunostained section to illustrate the distribution pattern of Aβ-ir plaques and PHFpS396–ir neurons, respectively. D) Merge of both channels showing both anti-Aβ and anti-PHFpS396 antibody labeling. E, F) Higher magnification of the CA1 region to show the immunostaining pattern of PHFpS396–ir neurons (E) and Aβ-ir plaques (F). DG, dentate gyrus; CA1–CA3, cornu ammonis fields; SUB, subiculum; Rad, stratum radiatum; Pyr, stratum pyramidale; Or, stratum oriens. Scale bar (in F): 20μm in A; 25μm in B, C, D; 50μm in E, F.
Fig. 2
Fig. 2
Maps of the hippocampal formation from AD patients to illustrate plaque distribution and staining patterns in CA1. Plots are based on the analysis of double-immunostained sections for anti-Aβ and anti-PHF-Tau antibodies. Borders between hippocampal fields are indicated by lines. CA1 is marked with a rectangle. Below each section profile, CA1 is shown schematically with its corresponding subregions and layers. Green dots correspond to Aβ-ir plaques, red dots to PHF-Tau-ir plaques (either PHFpS396 or PHFAT8), and yellow dots indicate plaques expressing both Aβ and PHF-Tau proteins. A–F) Representative drawings from patients Az1, Az2, Az3, Az4, Az5 and Az6, respectively. DG, dentate gyrus; CA1–CA3, cornu ammonis fields; SUB, subiculum; Prox, proximal; Med, medial; Dist, distal; Or, stratum oriens; Pyr, stratum pyramidale; Rad, stratum radiatum. Scale bar (in F): 2000μm.
Fig. 3
Fig. 3
Photomicrograph of the hippocampal formation from an AD patient in a double-stained section (Nissl and anti-Aβ). A) Low-power microphotograph to illustrate the hippocampal fields. B) Higher magnification of the boxed area in A, showing the distribution of plaques by layer in CA1 (Lac-mol, stratum lacunosum-moleculare; Rad, stratum radiatum; Pyr, stratum pyramidale; Or, stratum oriens). Note that no plaques are visualized in stratum lacunosum-moleculare or in oriens. DG, dentate gyrus; CA1–CA3, cornus ammonis fields; SUB, subiculum. Scale bar: 1000μm (in B); 860μm (in A).
Fig. 4
Fig. 4
Plaque expression patterns in double-stained hippocampal sections. Trios of confocal stack projection images taken from Aβ/PHFpS396 double-immunostained sections (A, B, E) and from Aβ/PHFAT8 double-immunostained sections (C, D). Plaques expressing both Aβ and PHFpS396, as well as Aβ and PHFAT8 are shown in A and C, respectively. Images illustrate plaques expressing only PHFpS396 (B) and PHFAT8 (D). A plaque which only displays anti-Aβ is shown in E. Scale bar (in E): 50μm.
Fig. 5
Fig. 5
Pie charts showing the percentages of labeled plaques in double immunostaining studies: Aβ/PHFpS396 (A) and Aβ/PHFAT8 (B) combinations are shown. Both analyses displayed a higher proportion of plaques showing Aβ-ir and a much-reduced portion of negative Aβ plaques.
Fig. 6
Fig. 6
Confocal stack projection images from triple-stained (Methoxy-X04/anti- PHFpS396/anti-PHFAT8) hippocampal sections. In A and B, plaques do not express any anti-PHF-Tau isoform but they show staining for Methoxy-X04, which indicates the presence of Aβ. C and D: examples of labeled plaques showing the three markers — Methoxy-X04 / anti-PHFpS396 / anti-PHFAT8. Scale bar (in D): 50μm.
Fig. 7
Fig. 7
Analysis of the distribution and expression of PHF-Tau-ir neurons using Imaris software. A) Confocal microscopy image showing a double-immunostained section for PHFpS396 (green) and PHFAT8 (red) antibodies, in CA1 region from patient Az4. The entire CA1 region can be visualized. B) Spots are assigned to each neuron, easily visualized when confocal channels are turned off. C) The rectangle is a higher magnification of the region marked by the arrowheads in B. The different spot colors correspond to PHFpS396-ir neurons (green), PHFAT8-ir neurons (red), and coexpressing neurons (yellow). Scale bar: 200μm (in B); 50μm in (C).
Fig. 8
Fig. 8
Confocal stack projection images to illustrate labeling patterns of neurons in double-immunostained sections for PHFpS396 and PHFAT8. Low-power confocal images of the hippocampal formation showing immunostaining for PHFpS396 (A, in green) and PHFAT8 (B, in red). Arrowheads indicate CA1 boundaries. C–H) Trios of confocal stack projection images taken from PHFpS396/PHFAT8 double-immunostained sections. Arrows designate neurons expressing both anti-PHFpS396 and anti-PHFAT8 (C–E). Arrowheads indicate a neuron expressing anti-PHFAT8, and asterisks indicate two neurons expressing only PHFpS396. DG, dentate gyrus; CA1–CA3, cornu ammonis fields; SUB, subiculum. Scale bar (in H): 922μm (in A, B) and 50μm (in C–H).
Fig. 9
Fig. 9
Pie charts showing the percentages of labeled neurons in double immunostaining studies for PHFpS396 and PHFAT8. Note the high variability of patterns. Average percentages of expression patterns are shown in the “Summary” chart, in which it is clear that there is a higher proportion of PHFpS396-ir neurons.

References

    1. Alzheimer’s Association (2017) Alzheimer’s disease: Facts and figures. Alzheimers Dement 13, 325-373.
    1. Grundke-Iqbal I, Iqbal K, Tung YC, Quinlan M, Wisniewski HM, Binder LI (1986) Abnormal phosphorylation of the microtubule-associated protein tau (tau) in Alzheimer cytoskeletal pathology. Proc Natl Acad Sci U S A 83, 4913-4917. - PMC - PubMed
    1. Goedert M, Wischik CM, Crowther RA, Walker JE, Klug A (1988) Cloning and sequencing of the cDNA encoding a core protein of the paired helical filament of Alzheimer disease: Identification as the microtubule-associated protein tau. Proc Natl Acad Sci U S A 85, 4051-4055. - PMC - PubMed
    1. Avila J (2004) The influence of aging in one tauopathy: Alzheimer ’s disease. Arch Immunol Ther Exp 52, 410-413. - PubMed
    1. Wilson RS, Arnold SE, Schneider JA, Kelly JF, Tang Y, Bennett DA (2006) Chronic psychological distress and risk of Alzheimer’s disease in old age. Neuroepidemiology 27, 143-153. - PubMed

Publication types