. 2018 Jun 19;19(1):477.
doi: 10.1186/s12864-018-4772-0.

Slingshot: cell lineage and pseudotime inference for single-cell transcriptomics

Affiliations

Slingshot: cell lineage and pseudotime inference for single-cell transcriptomics

Kelly Street et al. BMC Genomics. .

Abstract

Background: Single-cell transcriptomics allows researchers to investigate complex communities of heterogeneous cells. It can be applied to stem cells and their descendants in order to chart the progression from multipotent progenitors to fully differentiated cells. While a variety of statistical and computational methods have been proposed for inferring cell lineages, the problem of accurately characterizing multiple branching lineages remains difficult to solve.

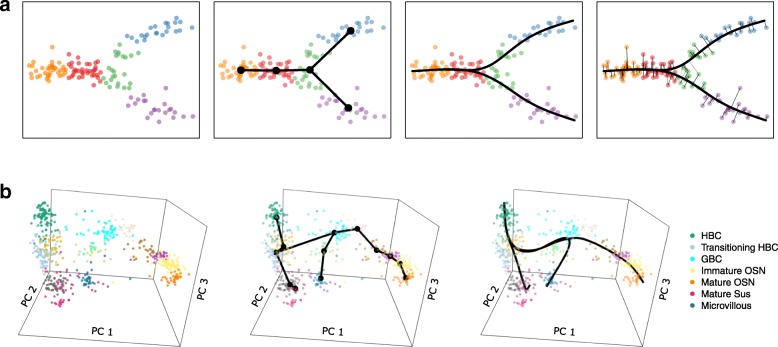
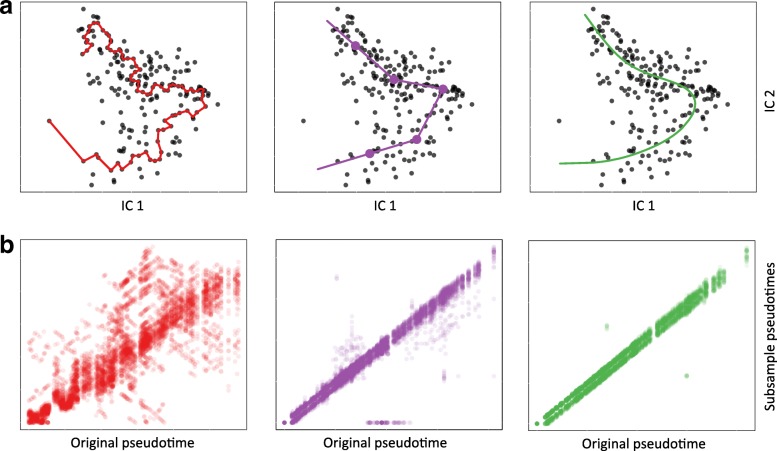
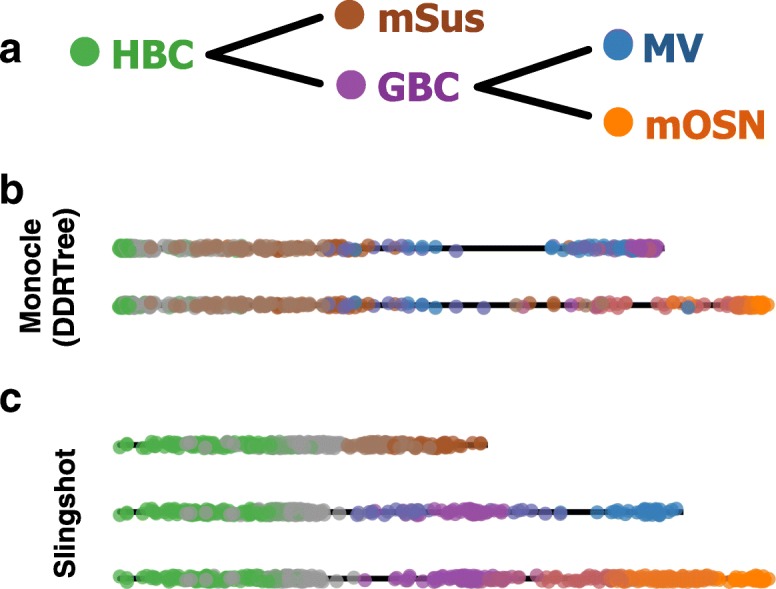
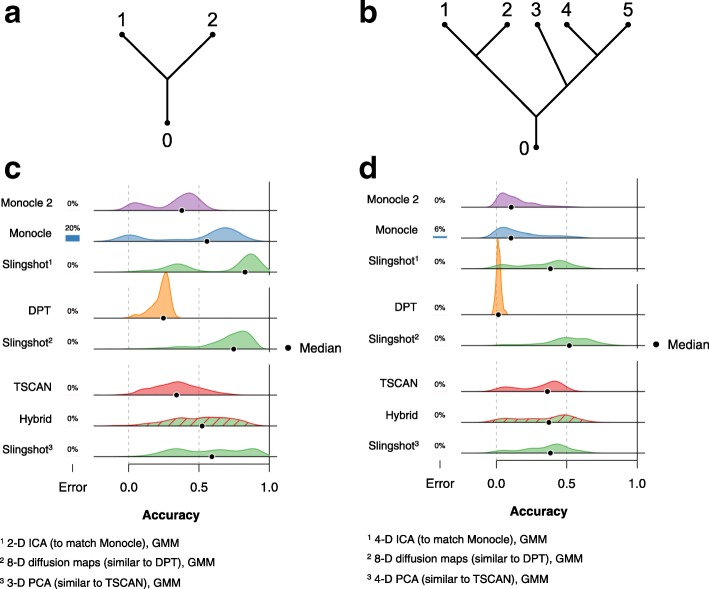
Results: We introduce Slingshot, a novel method for inferring cell lineages and pseudotimes from single-cell gene expression data. In previously published datasets, Slingshot correctly identifies the biological signal for one to three branching trajectories. Additionally, our simulation study shows that Slingshot infers more accurate pseudotimes than other leading methods.

Conclusions: Slingshot is a uniquely robust and flexible tool which combines the highly stable techniques necessary for noisy single-cell data with the ability to identify multiple trajectories. Accurate lineage inference is a critical step in the identification of dynamic temporal gene expression.

Keywords: Lineage inference; Pseudotime inference; RNA-Seq; Single cell.


Conflict of interest statement

Ethics approval and consent to participate

Ethics approval and consent to participate were not applicable to this study.

Publisher’s Note

Springer Nature remains neutral with regard to jurisdictional claims in published maps and institutional affiliations.

Figures

Fig. 1
Fig. 1
Schematics of Slingshot’s main steps. The main steps for Slingshot are shown for: Panel (a) a simple simulated two-lineage two-dimensional dataset and Panel (b) the single-cell RNA-Seq olfactory epithelium three-lineage dataset of [26] (see Results and discussion for details on dataset and its analysis). Step 0: Slingshot starts from clustered data in a low-dimensional space (cluster labels indicated by color). For Panel (b), the plot shows the top three principal components, but Slingshot was run on the top five. Step 1: A minimum spanning tree is constructed on the clusters to determine the number and rough shape of lineages. For Panel (b), we impose some constraints on the MST based on known biology. Step 2: Simultaneous principal curves are used to obtain smooth representations of each lineage. Step 3: Pseudotime values are obtained by orthogonal projection onto the curves (only shown for Panel (a))
Fig. 2
Fig. 2
Robustness of lineage and pseudotime inference methods: HSMM dataset. We examine the stability of three lineage and pseudotime inference approaches on the single-lineage HSMM dataset of [3], showing how each method orders the cells for the original dataset, as well as for 50 subsamples of the data. Panel (a): Monocle identifies the longest path through an MST constructed on all cells (red). Waterfall and TSCAN cluster cells and connect cluster centers with an MST (purple, clustering performed by k-means with k=5). Embeddr and Slingshot order cells using a principal curve, i.e., a non-linear fit through the data (green). As in [3], dimensionality reduction is performed by ICA. Panel (b): Scatterplots of pseudotimes based on 50 subsamples of the data vs. pseudotimes for the original dataset. Subsamples were generated in a bootstrap-like manner, by randomly sampling n times, with replacement from the original cell-level data and retaining only one instance of each cell. Thus, subsamples were of variable sizes, but contained on average about 63% of the original cells. The cluster-based MST method occasionally detected spurious branching events and, for the purpose of visualization, cells not placed along the main lineage were assigned a pseudotime value of 0
Fig. 3
Fig. 3
Multiple lineage inference: OE dataset. Pseudotime variables for each lineage inferred by Slingshot and Monocle 2 on the three-lineage OE dataset of [26]. Panel (a): Known biological relationships between cell types. Panel (b): For Monocle 2, we used the DDRTree algorithm to obtain a two-dimensional (or five-dimensional, see Additional file 1: Figure S3d) representation of the data and selected the starting state based on the highest percentage of cells from the HBC cluster. Panel (c): For Slingshot, we used the top five PCs and clustered cells by RSEC, as in the original article. The HBC cluster was specified as the origin and the mSus cluster as an endpoint; other endpoints were identified without supervision
Fig. 4
Fig. 4
Comparison of accuracy scores for lineage and pseudotime inference methods: Simulated datasets. Gaussian kernel density plots of accuracy scores show how five lineage inference methods performed on a series of simulated datasets with two different topologies: Panels (a,c) two lineages and Panels (b,d) five lineages. In both settings, the simulated data contained variable numbers of cells and levels of noise. Bars to the left of each density plot represent the percentage of datasets on which a method returned an error. Errors are treated as 0 values for calculating the median score, but are not included in the density estimates. Monocle, Monocle 2, DPT, and TSCAN were implemented in several ways and these densities represent the best results obtained by each method. Slingshot was implemented with various dimensionality reduction techniques, chosen to match the best-case settings of the other methods and with clusters assigned by Gaussian mixture modeling (GMM). See Simulation study for the definition of accuracy scores based on Kendall’s rank correlation coefficient and Additional file 1 for details on simulation scenarios
Fig. 5
Fig. 5
Robustness of Slingshot pseudotimes to clustering method: Simulated two-lineage datasets. Gaussian kernel density plots of accuracy scores for different clustering methods (columns) and numbers of clusters (rows) based on simulated data with two lineages. Clustering was performed using hierarchical clustering, k-means, and Gaussian mixture modeling, with a range of values for the number of clusters, K. Principal component analysis was used for dimensionality reduction with two values for the number of components J: in Panel (a), three-dimensional PCA produced highly variable scores, while in Panel (b), four-dimensional PCA produced consistently high scores. Both panels show that Slingshot produces similar distributions of accuracy scores over a range of values for K. However, when K=3, Slingshot is often unable to detect the branching event and the resulting pseudotimes imperfectly match either true lineage. With more clusters, we see consistently accurate results. At higher values of K (not shown), accuracy scores begin to degrade slowly, as Slingshot begins to overfit and identify more spurious branching events. See “Simulation study” section for the definition of accuracy scores based on Kendall’s rank correlation coefficient and Additional file 1 for details on simulation scenarios

References

    1. Kolodziejczyk AA, Kim JK, Svensson V, Marioni JC, Teichmann SA. The technology and biology of single-cell RNA sequencing. Mol Cell. 2015;58(4):610–20. doi: 10.1016/j.molcel.2015.04.005. - DOI - PubMed
    1. Wagner A, Regev A, Yosef N. Revealing the vectors of cellular identity with single-cell genomics. Nat Biotechnol. 2016;34(11):1145–60. doi: 10.1038/nbt.3711. - DOI - PMC - PubMed
    1. Trapnell C, Cacchiarelli D, Grimsby J, Pokharel P, Li S, Morse M, Lennon NJ, Livak KJ, Mikkelsen TS, Rinn JL. The dynamics and regulators of cell fate decisions are revealed by pseudotemporal ordering of single cells. Nat Biotechnol. 2014;4(32):381–91. doi: 10.1038/nbt.2859. - DOI - PMC - PubMed
    1. Bendall S, Davis KL, Amir ED, Tadmor MD, Simonds EF, Chen TJ, Shenfeld DK, Nolan GP, Pe’er D. Single-cell trajectory detection uncovers progression and regulatory coordination in human B cell development. Cell. 2014;157(3):714–25. doi: 10.1016/j.cell.2014.04.005. - DOI - PMC - PubMed
    1. Campbell K, Ponting CP, Webber C. Laplacian eigenmaps and principal curves for high resolution pseudotemporal ordering of single-cell RNA-seq profiles. Technical report, Functional Genomics Unit, MRC, University of Oxford, UK. 2015. biorxiv.org/content/early/2015/09/18/027219.