

Performance of epistasis detection methods in semi-simulated GWAS
- PMID: 29914375
- PMCID: PMC6006572
- DOI: 10.1186/s12859-018-2229-8
Performance of epistasis detection methods in semi-simulated GWAS
Abstract
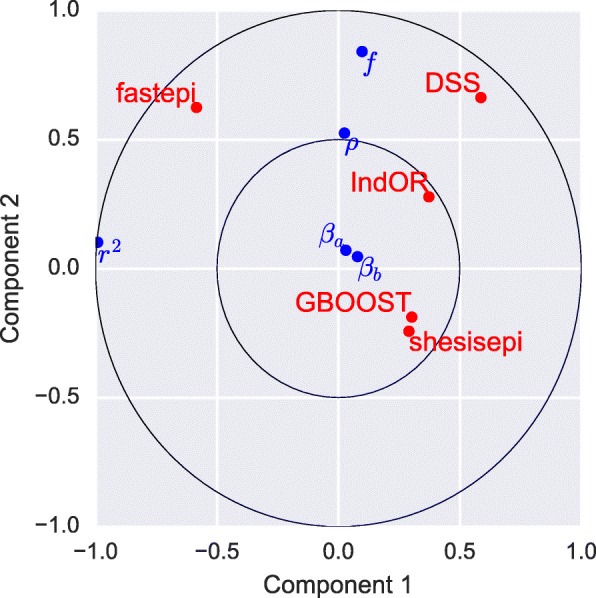
Background: Part of the missing heritability in Genome Wide Association Studies (GWAS) is expected to be explained by interactions between genetic variants, also called epistasis. Various statistical methods have been developed to detect epistasis in case-control GWAS. These methods face major statistical challenges due to the number of tests required, the complexity of the Linkage Disequilibrium (LD) structure, and the lack of consensus regarding the definition of epistasis. Their limited impact in terms of uncovering new biological knowledge might be explained in part by the limited amount of experimental data available to validate their statistical performances in a realistic GWAS context. In this paper, we introduce a simulation pipeline for generating real scale GWAS data, including epistasis and realistic LD structure. We evaluate five exhaustive bivariate interaction methods, fastepi, GBOOST, SHEsisEpi, DSS, and IndOR. Two hundred thirty four different disease scenarios are considered in extensive simulations. We report the performances of each method in terms of false positive rate control, power, area under the ROC curve (AUC), and computation time using a GPU. Finally we compare the result of each methods on a real GWAS of type 2 diabetes from the Welcome Trust Case Control Consortium.
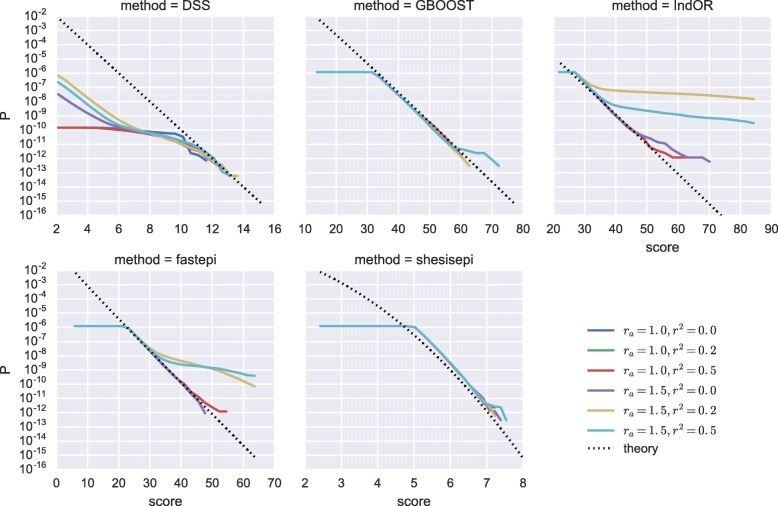
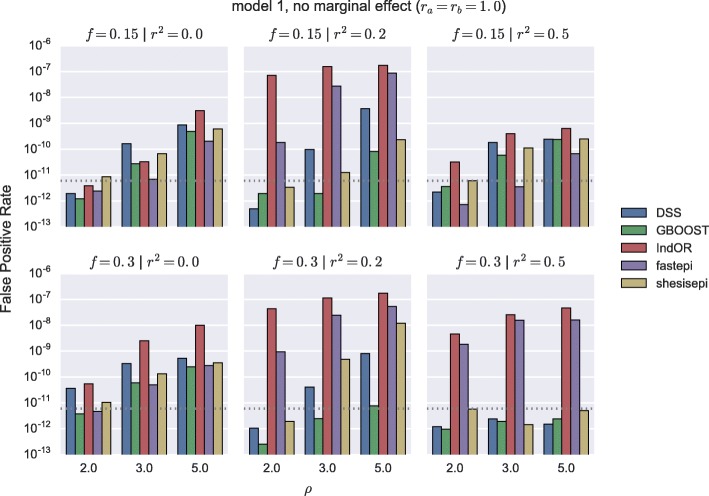
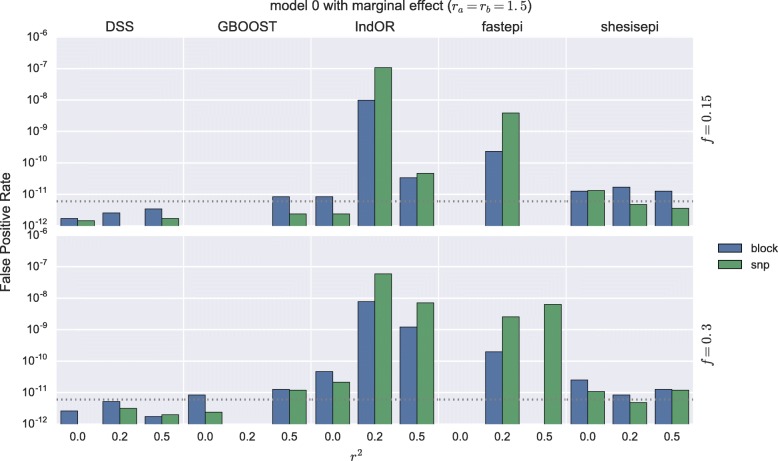
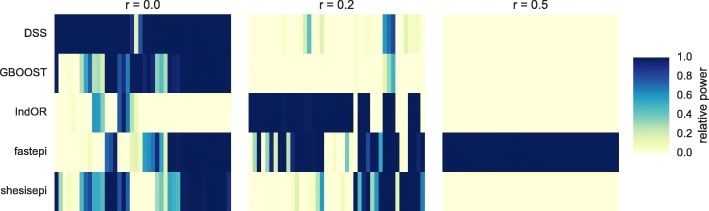
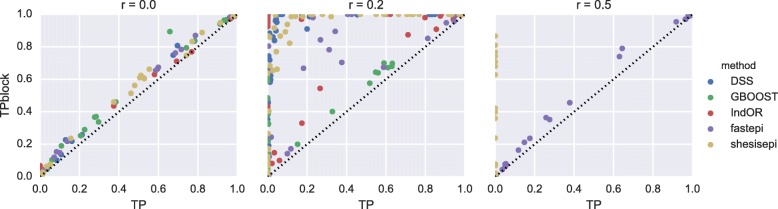
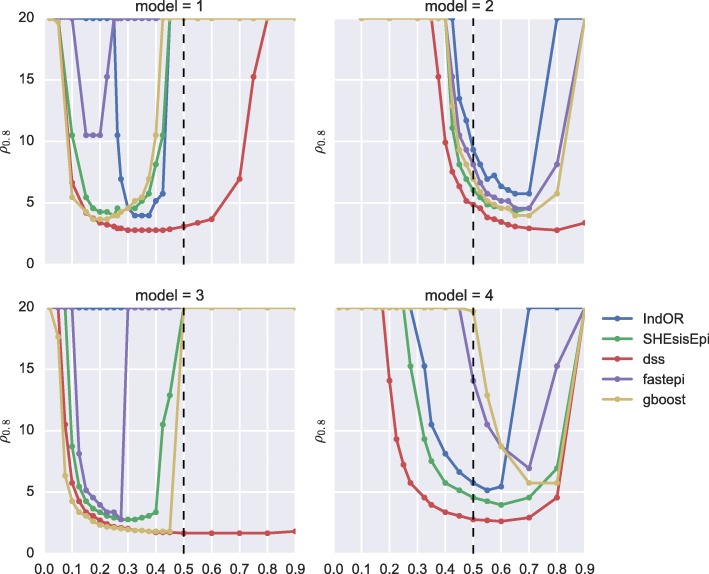
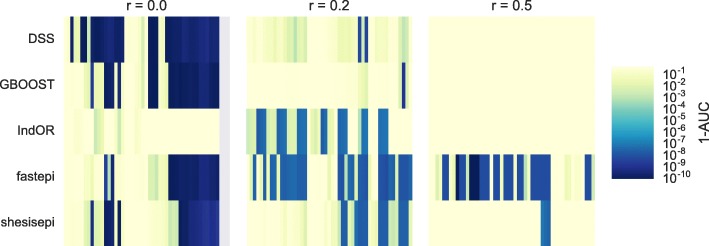
Results: GBOOST, SHEsisEpi and DSS allow a satisfactory control of the false positive rate. fastepi and IndOR present an increase in false positive rate in presence of LD between causal SNPs, with our definition of epistasis. DSS performs best in terms of power and AUC in most scenarios with no or weak LD between causal SNPs. All methods can exhaustively analyze a GWAS with 6.105 SNPs and 15,000 samples in a couple of hours using a GPU.
Conclusion: This study confirms that computation time is no longer a limiting factor for performing an exhaustive search of epistasis in large GWAS. For this task, using DSS on SNP pairs with limited LD seems to be a good strategy to achieve the best statistical performance. A combination approach using both DSS and GBOOST is supported by the simulation results and the analysis of the WTCCC dataset demonstrated that this approach can detect distinct genes in epistasis. Finally, weak epistasis between common variants will be detectable with existing methods when GWAS of a few tens of thousands cases and controls are available.
Keywords: Epistasis; Genome-wide association studies; Simulation.
Conflict of interest statement
Ethics approval and consent to participate
Not applicable.
Competing interests
The authors declare that they have no competing interests.
Publisher’s Note
Springer Nature remains neutral with regard to jurisdictional claims in published maps and institutional affiliations.
Figures
Similar articles
-
GWIS--model-free, fast and exhaustive search for epistatic interactions in case-control GWAS.BMC Genomics. 2013;14 Suppl 3(Suppl 3):S10. doi: 10.1186/1471-2164-14-S3-S10. Epub 2013 May 28. BMC Genomics. 2013. PMID: 23819779 Free PMC article.
-
IndOR: a new statistical procedure to test for SNP-SNP epistasis in genome-wide association studies.Stat Med. 2012 Sep 20;31(21):2359-73. doi: 10.1002/sim.5364. Epub 2012 Jun 18. Stat Med. 2012. PMID: 22711278
-
Development of GMDR-GPU for gene-gene interaction analysis and its application to WTCCC GWAS data for type 2 diabetes.PLoS One. 2013 Apr 23;8(4):e61943. doi: 10.1371/journal.pone.0061943. Print 2013. PLoS One. 2013. PMID: 23626757 Free PMC article.
-
Review on GPU accelerated methods for genome-wide SNP-SNP interactions.Mol Genet Genomics. 2024 Dec 29;300(1):10. doi: 10.1007/s00438-024-02214-6. Mol Genet Genomics. 2024. PMID: 39738695 Review.
-
Finding the epistasis needles in the genome-wide haystack.Methods Mol Biol. 2015;1253:19-33. doi: 10.1007/978-1-4939-2155-3_2. Methods Mol Biol. 2015. PMID: 25403525 Review.
Cited by
-
Bench Research Informed by GWAS Results.Cells. 2021 Nov 15;10(11):3184. doi: 10.3390/cells10113184. Cells. 2021. PMID: 34831407 Free PMC article. Review.
-
A new method for exploring gene-gene and gene-environment interactions in GWAS with tree ensemble methods and SHAP values.BMC Bioinformatics. 2021 May 4;22(1):230. doi: 10.1186/s12859-021-04041-7. BMC Bioinformatics. 2021. PMID: 33947323 Free PMC article.
-
Evaluation of epistasis detection methods for quantitative phenotypes.bioRxiv [Preprint]. 2025 May 14:2025.04.30.651312. doi: 10.1101/2025.04.30.651312. bioRxiv. 2025. PMID: 40463086 Free PMC article. Preprint.
-
Evaluating the detection ability of a range of epistasis detection methods on simulated data for pure and impure epistatic models.PLoS One. 2022 Feb 18;17(2):e0263390. doi: 10.1371/journal.pone.0263390. eCollection 2022. PLoS One. 2022. PMID: 35180244 Free PMC article.
-
MIDESP: Mutual Information-Based Detection of Epistatic SNP Pairs for Qualitative and Quantitative Phenotypes.Biology (Basel). 2021 Sep 16;10(9):921. doi: 10.3390/biology10090921. Biology (Basel). 2021. PMID: 34571798 Free PMC article.
References
-
- Manolio TA, Collins FS, Cox NJ, Goldstein DB, Hindorff LA, Hunter DJ, McCarthy MI, Ramos EM, Cardon LR, Chakravarti A, Cho JH, Guttmacher AE, Kong A, Kruglyak L, Mardis E, Rotimi CN, Slatkin M, Valle D, Whittemore AS, Boehnke M, Clark AG, Eichler EE, Gibson G, Haines JL, Mackay TFC, McCarroll SA, Visscher PM. Finding the missing heritability of complex diseases. Nature. 2009;461(7265):747–53. doi: 10.1038/nature08494. - DOI - PMC - PubMed
Publication types
MeSH terms
LinkOut - more resources
Full Text Sources
Other Literature Sources
Medical
Research Materials
