. 2018 Jun 18;12(1):70.
doi: 10.1186/s12918-018-0596-4.

Single molecules can operate as primitive biological sensors, switches and oscillators

Affiliations

Single molecules can operate as primitive biological sensors, switches and oscillators

Rosa D Hernansaiz-Ballesteros et al. BMC Syst Biol. .

Abstract

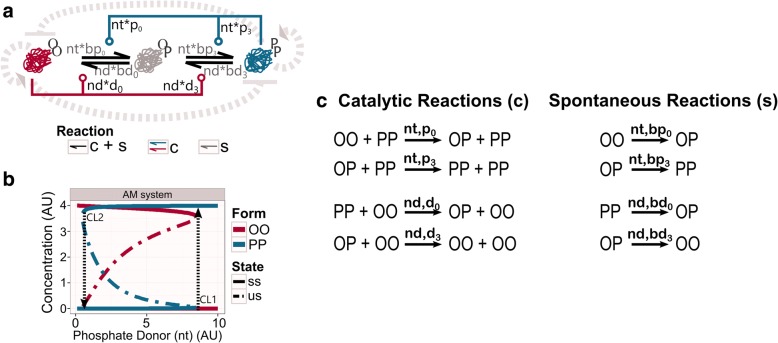
Background: Switch-like and oscillatory dynamical systems are widely observed in biology. We investigate the simplest biological switch that is composed of a single molecule that can be autocatalytically converted between two opposing activity forms. We test how this simple network can keep its switching behaviour under perturbations in the system.

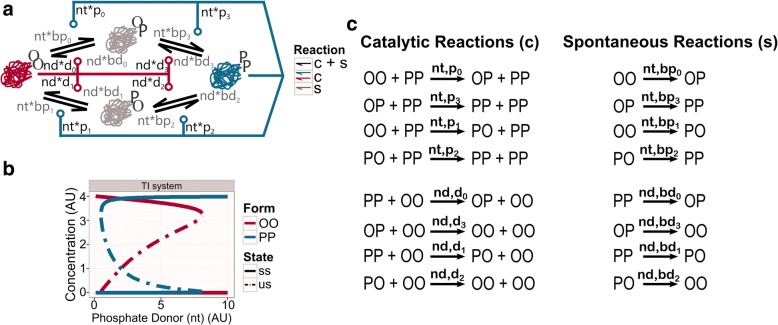
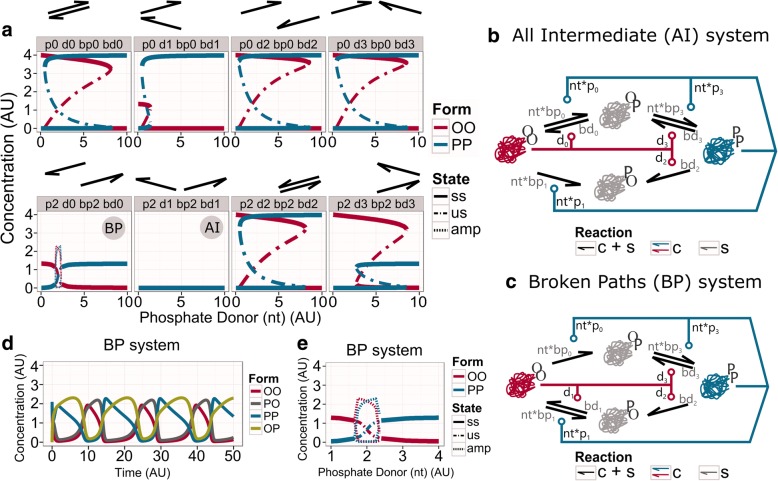
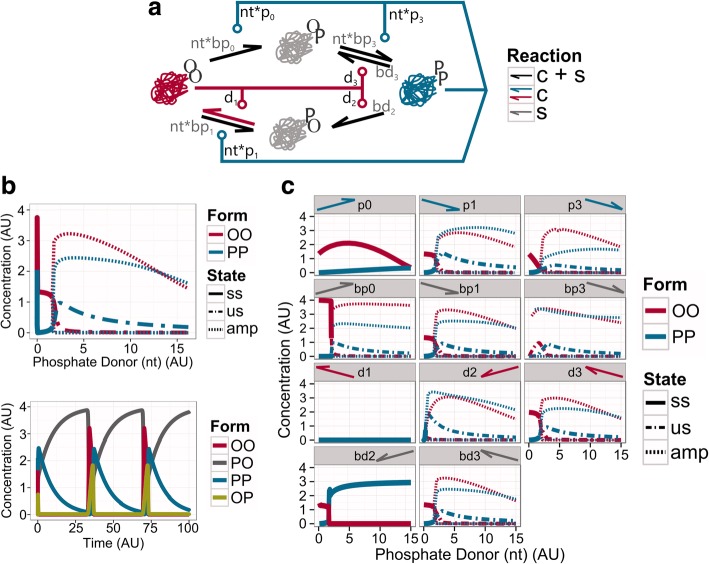
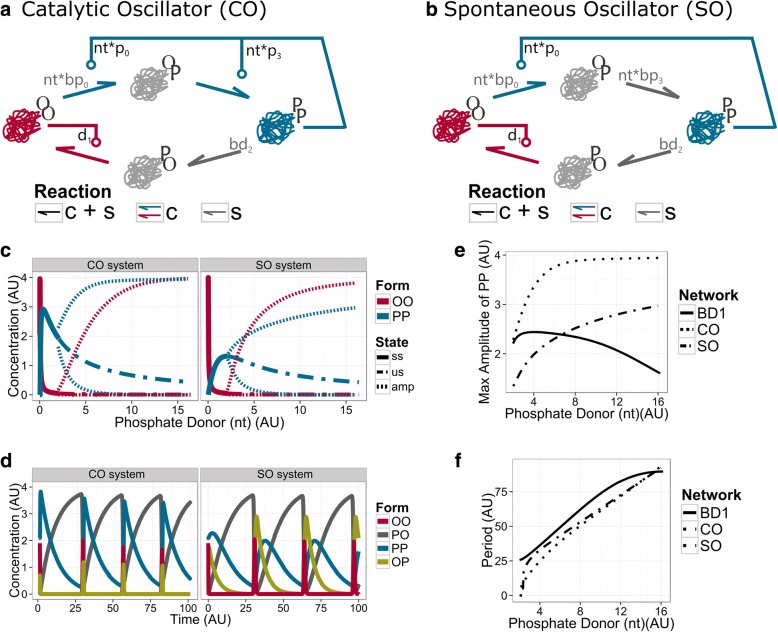
Results: We show that this molecule can work as a robust bistable system, even for alterations in the reactions that drive the switching between various conformations. We propose that this single molecule system could work as a primitive biological sensor and show by steady state analysis of a mathematical model of the system that it could switch between possible states for changes in environmental signals. Particularly, we show that a single molecule phosphorylation-dephosphorylation switch could work as a nucleotide or energy sensor. We also notice that a given set of reductions in the reaction network can lead to the emergence of oscillatory behaviour.

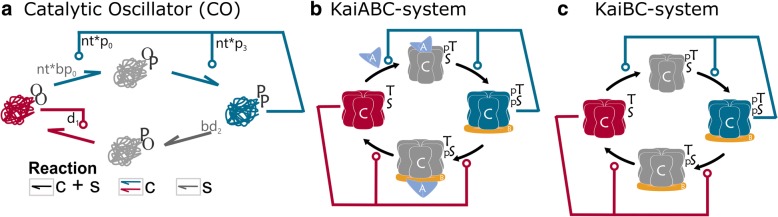
Conclusions: We propose that evolution could have converted this switch into a single molecule oscillator, which could have been used as a primitive timekeeper. We discuss how the structure of the simplest known circadian clock regulatory system, found in cyanobacteria, resembles the proposed single molecule oscillator. Besides, we speculate if such minimal systems could have existed in an RNA world.

Keywords: Approximate majority; Bistability; Circadian rhythm; Computational biology; Evolution; Mathematical modelling; Multistability; Networks; Oscillation; RNA world.


Conflict of interest statement

Ethics approval and consent to participate

Not applicable.

Competing interests

The authors declare that they have no competing interests.

Publisher’s Note

Springer Nature remains neutral with regard to jurisdictional claims in published maps and institutional affiliations.

Figures

Fig. 1
Fig. 1
Approximate Majority (AM) system. a Wiring diagram of the AM network. PP form attracts molecules into this state, while OO form does the opposite, both via catalytic reactions. Background reactions happen between all conformations at a low rate (grey shades on arrows). As an illustration of the embedded positive feedback loops, striped grey arrows indicate the pure positive feedback loops. The striped dash-end indicate the double-negative positive feedback loop. b Bifurcation analysis of the AM system. The plot shows how the concentration of the catalytic molecules, OO and PP, is affected by the availability of phosphate donor (nt). The stable steady state (ss) is indicated by a solid line, while the unstable steady state (us) is defined by the dash-dotted line. CL1 and CL2 indicate the threshold points at which the jump between the off and the on states happen. Black striped arrows indicate the direction of the jumps. See networks topology in Methods for more information about the structure. Consult Table 2 in Methods for values of each parameter. c List of reactions. The left column shows the catalytic reactions, while the right column presents the spontaneous reactions. On top of each reaction arrows, the parameter names that affect the specific reaction are indicated
Fig. 2
Fig. 2
Two intermediates (TI) system. a Wiring diagram of the TI system. Single-modified forms (OP, PO) are physically different. b Bifurcation analysis of TI system. The graphic shows how the concentration of the catalytic molecules, OO and PP, is affected by the availability of phosphate donor (nt). We speculate that the TI system could have served as a primitive molecular sensor of phosphate donor level. Thus, TI could get into the PP form only above a critical threshold, where it remains until the phosphate level drops below a lower critical level. The stable steady state (ss) is indicated by a solid line, while the unstable steady state (us) is labelled by the dash-dotted line. See networks topology in Methods for more information about the structure. Table 2 in Methods for values of each parameter. c List of reactions. The left column shows the catalytic reactions, while the right column gives the spontaneous reactions. On top of each reaction arrow, the parameter names that affect the specific reaction are indicated
Fig. 3
Fig. 3
Analysis of removing reactions in pairs from the TI system. a Bifurcation diagrams showing the steady states of the systems where two catalytic reactions, and their corresponded spontaneous reactions, have been removed from the TI network. The arrows above each panel indicate which reactions have been dropped. The stable state (ss) is indicated by a solid line, the unstable steady state (us) is defined by the dash-dotted line, and the maxima and minima of oscillations (amp – for amplitude) are shown by dashed lines. b Wiring diagram of the All Intermediate (AI) network. The reactions that convert PO into OO and PP are both missing, so all molecules end up in this single-phosphorylated form. c Wiring diagram of the Broken Paths (BP) network. The reaction from PO to PP was dropped together with the reaction from OP to OO. d Time course diagram for the BP network in the oscillatory regime (phosphate donor nt = 2.2 AU). e Zoom in the bifurcation diagram of the BP system (panel “p2 d0 bp2 bd0”). See networks topology in Methods for more information about the structure. Table 2 in Methods contain the values of parameters
Fig. 4
Fig. 4
BD1 system and the behaviour of altered topologies diverged from it. a Wiring diagram of the BD1 network. b Bifurcation (up) and time course (down) analysis of the BD1 network. The bifurcation diagram shows the changes in the steady states of the catalytic forms. The stable steady state (ss) is indicated by a straight line, the unstable steady state (us) is defined by the dashed-dot line, and the maxima and minima of oscillations (amp for amplitude) are shown by dashed lines. The phosphate donor for the time course diagram is set to nt = 4 AU. c Bifurcation analysis of the effect of the loss of one extra reaction from the BD1 network. The legend above each panel indicates which parameters have been removed (by name of the parameter and the arrow that represents it). Labels same as on panel (b)
Fig. 5
Fig. 5
The minimal oscillatory systems: Catalytic Oscillator (CO) network and Spontaneous Oscillator (SO) networks. Wiring diagram of CO (a) and SO (b) networks. Both networks maintain the spontaneous dephosphorylation of PP into PO (grey arrow), OO has the control over the modification of PO into itself, and PP keeps its catalytic control over the transition from OO to OP. In the CO network PP also catalyses the phosphorylation of OP into PP, while in the SO network this reaction is spontaneous. c Bifurcation analysis. The graphic shows how the steady-state concentration of the catalytic molecules, OO and PP are affected by the availability of phosphate donor (nt). Stable steady states (ss) precedes the oscillatory solutions (unstable steady state (us) – dashed line, max and min of the amplitude of oscillation (amp) - striped lines). d Time course diagram. The phosphate donor is set to nt = 4 AU. e Maximal amplitude of the BD1, CO and SO networks. f Period of the BD1, CO and SO networks over a range of phosphate donor values. See networks topology in Methods for more information about the structure and Table 2 in Methods for values of parameters
Fig. 6
Fig. 6
Similarities in the topologies of the CO oscillatory network and the KaiC system of cyanobacteria. a CO system (b) KaiABC-system of S. elongatus. KaiA (blue triangle) stimulates the autokinase activity of KaiC to covert the fully dephosphorylated form of KaiC (red) into its fully phosphorylated form (blue). KaiB (flat orange circle) binds to fully phosphorylated KaiC, this leads to the displacement of KaiA and enhances the autophosphatase activity of KaiC. c KaiBC-system of Prochlorococcus. KaiB (flat orange circle) binds KaiC in its fully phosphorylated form (blue) and enhances its autophosphatase activity, but KaiA is missing, so KaiC can phosphorylate itself without support from KaiA [–64]

References

    1. Thomas R, Thieffry D, Kaufman M. Dynamical behaviour of biological regulatory networks—I. Biological role of feedback loops and practical use of the concept of the loop-characteristic state. Bull Math Biol. 1995;57(2):247–276. doi: 10.1007/BF02460618. - DOI - PubMed
    1. Thomas R. Laws for the dynamics of regulatory networks. Int J Dev Biol. 2002;42(3):479–485. - PubMed
    1. Tyson JJ, Chen KC, Novak B. Sniffers, buzzers, toggles and blinkers: dynamics of regulatory and signaling pathways in the cell. Curr Opin Cell Biol. 2003;15(2):221–231. doi: 10.1016/S0955-0674(03)00017-6. - DOI - PubMed
    1. Santos SDM, biology FJES. On the cell cycle and its switches. Nature. 2008;454(7202):288–289. doi: 10.1038/454288a. - DOI - PMC - PubMed
    1. Cardelli L, Csikász-Nagy A. The cell cycle switch computes approximate majority. Sci Rep. 2012;2:656. https://www.nature.com/articles/srep00656. - PMC - PubMed

Publication types

LinkOut - more resources