. 2018 Jun 18;16(1):167.
doi: 10.1186/s12967-018-1547-y.

3D printing individualized heel cup for improving the self-reported pain of plantar fasciitis

Affiliations

3D printing individualized heel cup for improving the self-reported pain of plantar fasciitis

Lan Li et al. J Transl Med. .

Abstract

Background: To explore the therapeutic effect and the biomechanical mechanism of 3D printing individualized heel cup in treating of plantar heel pain.

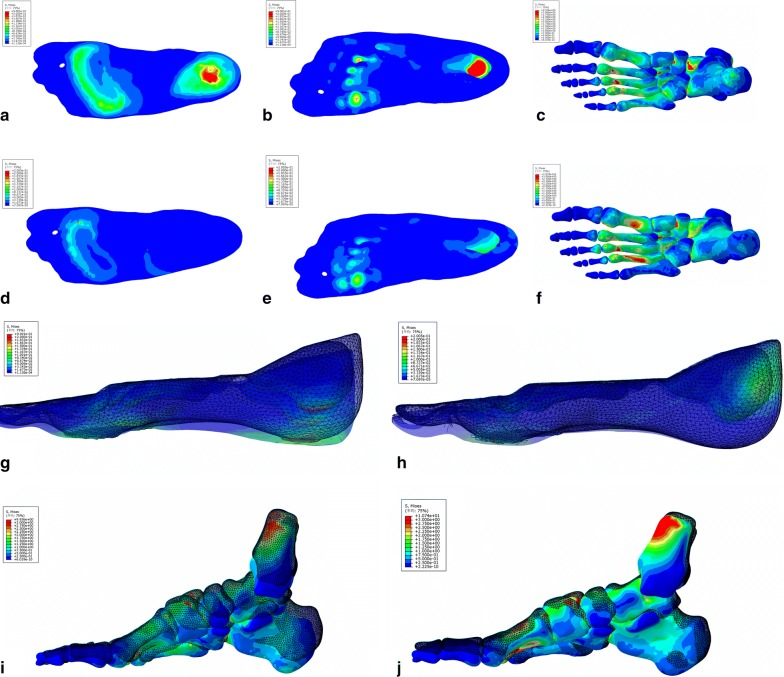
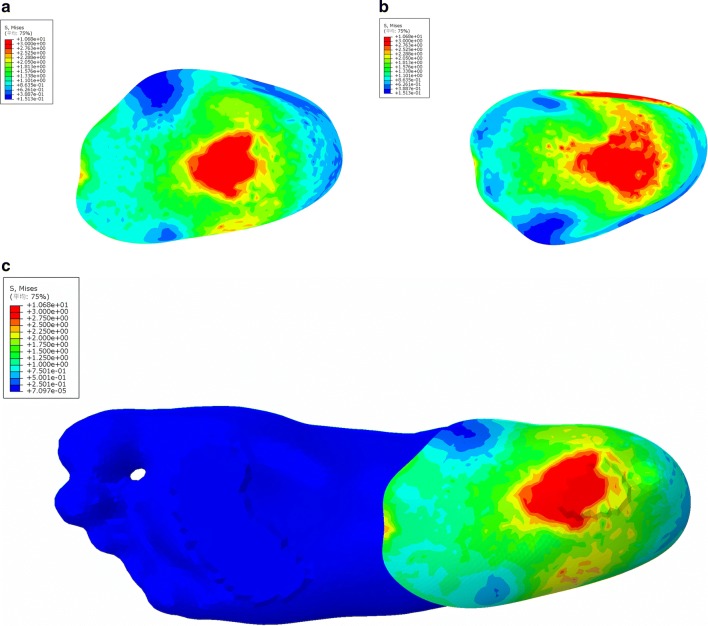
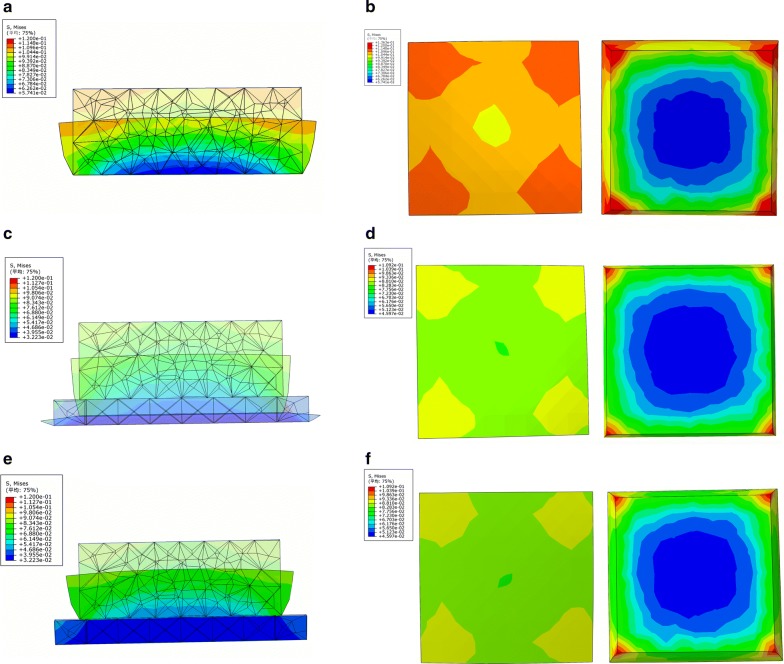
Methods: The clinical effect was evaluated by plantar pressure analysis and pain assessment in participants. Its biomechanical mechanism of protecting the plantar heel was explored using finite element simulation.

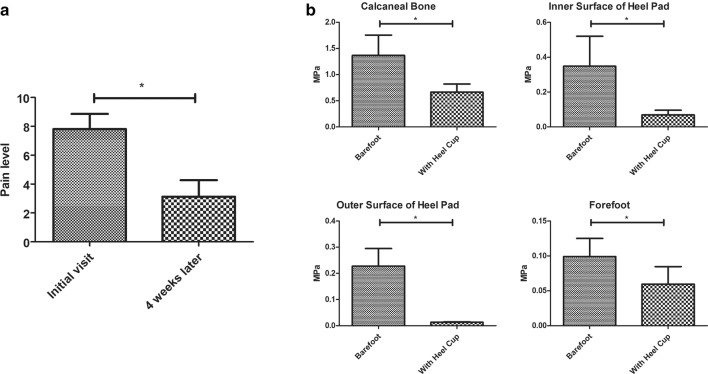
Results: The individualized heel cup could support and protect the osseous structure and soft tissue of plantar heel while walking and jogging, as well as significantly reduce the self-reported pain after being worn for 4 weeks. The nylon heel cup could alter the load concentration of the heel as well as decrease the load affected on plantar fascia and calcaneus bone. It also provided an obvious support for heel pad.

Conclusion: To summarize, the 3D printed individualized heel cup can be used as an effective method for the treatment of plantar heel pain.

Keywords: 3D printing; 3D scanning; Finite element; Heel cup; Heel pain; Relief pain.


Figures

Fig. 1
Fig. 1
3D scanning process and the design of individualized heel cup. a 3D scanning process. b The shape of heel cup. c The finished product made by 3D printing. The 3D impression drawing after wearing the individualized heel cup, the lateral view (d), the rear view (e), and the bottom view (f)
Fig. 2
Fig. 2
Plantar pressure analysis during walking (ad) and jogging (eh). a, e Overall load of forefoot and hind foot with bare foot. b, f Overall load of forefoot and hind with heel cup. The load increased on forefoot and decreased on hind foot. c, g Stress nephogram of plantar tissue with bare foot. d, h Stress nephogram of plantar tissue with heel cup. The region with orange on mid foot was replaced by green, indicating that the load in this region was reduced. The color that changed from red to blue represented the stress variation from large to small
Fig. 3
Fig. 3
a The pain score of participants. b Statistical results of stress in each region of foot. Values were mean ± SD. *P < 0.05
Fig. 4
Fig. 4
The plantar pressure distribution (af) and the structure behavior (gj) calculated by FE simulation. The bottom view (a) and top view (b) of plantar tissue, and the bottom view of ossature (c) with bare foot demonstrated that the load applied on plantar heel and forefoot was higher than other regions. The bottom view (d) and top view (e) of plantar tissue, and the bottom view of ossature (f) with heel cup showed that the red region in plantar heel disappeared and the color of calcaneus bone transferred from green to blue, indicating that the load decreased notably. The color that changed from red to blue represented the stress variation from large to small. The deformation of plantar soft tissue with bare foot (g) was more obvious than the tissue covered with heel cup (h). The same phenomenon could be observed on ossature structure between bare foot group (i) and heel cup group (j). The pattern made up of meshes represented the original shape, and the entity pattern represented the shape under compression
Fig. 5
Fig. 5
The pressure distribution of heel cup calculated by FE simulation. The bottom view (a), the top view (b) of heel cup, and the bottom view of foot (c) with heel cup indicated that the heel cup bore the load instead of heel pad
Fig. 6
Fig. 6
The results of the simplified FE model simulation. The three-view drawings of no-cup group (a, b), soft cup group (c, d), and hard cup group (e, f) demonstrated the deformation and stress of soft tissue and cup. The upper cube represented the soft tissue and the material parameters were same as soft tissue. The cube below represented the heel cup and the tensile modulus was set as 100 and 1800 MPa, respectively. The pattern made up of meshes represented the original shape, and the entity pattern represented the shape under compression. The color that changed from red to blue represented the stress variation from large to small

Similar articles

Cited by

References

    1. Soundberg S, Johnson K. Painful conditions of the heel. Disord Foot Ankle Med Surg Manag. 1991;2:1382–1396.
    1. Crawford F. Plantar heel pain and fasciitis. Clin Evid. 2003;2008(10):1431. - PubMed
    1. McPoil TG, Martin RL, Cornwall MW, Wukich DK, Irrgang JJ, Godges JJ. Heel pain–plantar fasciitis: clinical practice guidelines linked to the international classification of function, disability, and health from the orthopaedic section of the American Physical Therapy Association. J Orthop Sports Phys Ther. 2008;38(4):A1–A18. doi: 10.2519/jospt.2008.0302. - DOI - PubMed
    1. Irving DB, Cook JL, Young MA, Menz HB. Impact of chronic plantar heel pain on health-related quality of life. J Am Podiatr Med Assoc. 2008;98(4):283–289. doi: 10.7547/0980283. - DOI - PubMed
    1. Menz HB, Jordan KP, Roddy E, Croft PR. Characteristics of primary care consultations for musculoskeletal foot and ankle problems in the UK. Rheumatology. 2010;49(7):1391. doi: 10.1093/rheumatology/keq092. - DOI - PMC - PubMed

Publication types