. 2018 Jun 18;12(1):29.
doi: 10.1186/s40246-018-0160-8.

Oxidative stress-induced chromosome breaks within the ABL gene: a model for chromosome rearrangement in nasopharyngeal carcinoma

Affiliations

Oxidative stress-induced chromosome breaks within the ABL gene: a model for chromosome rearrangement in nasopharyngeal carcinoma

Sang-Nee Tan et al. Hum Genomics. .

Abstract

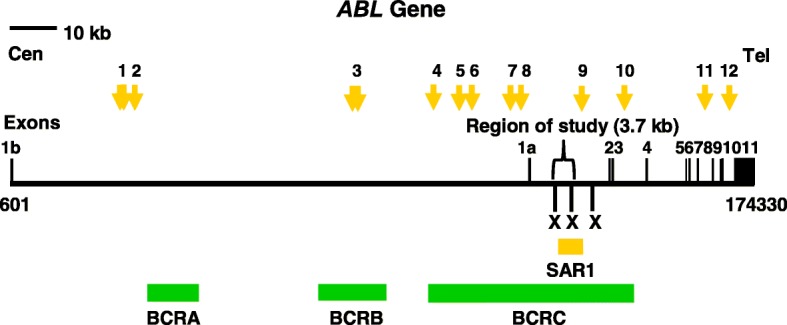
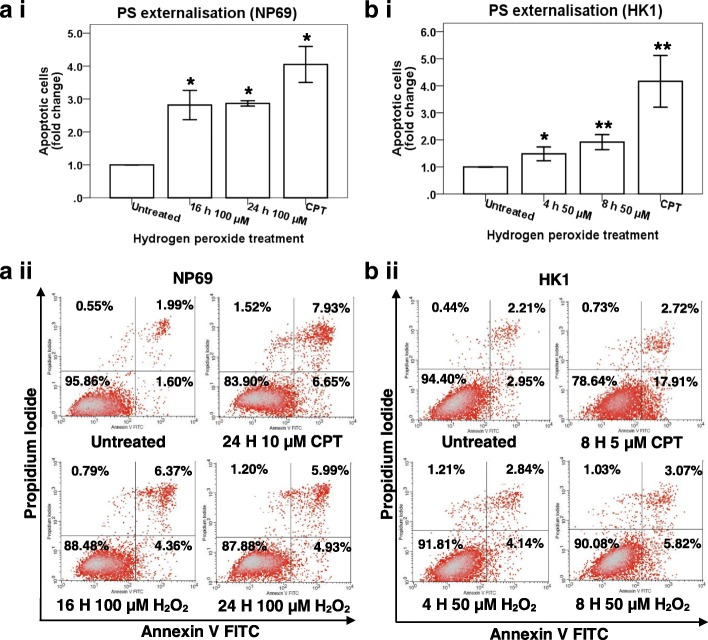
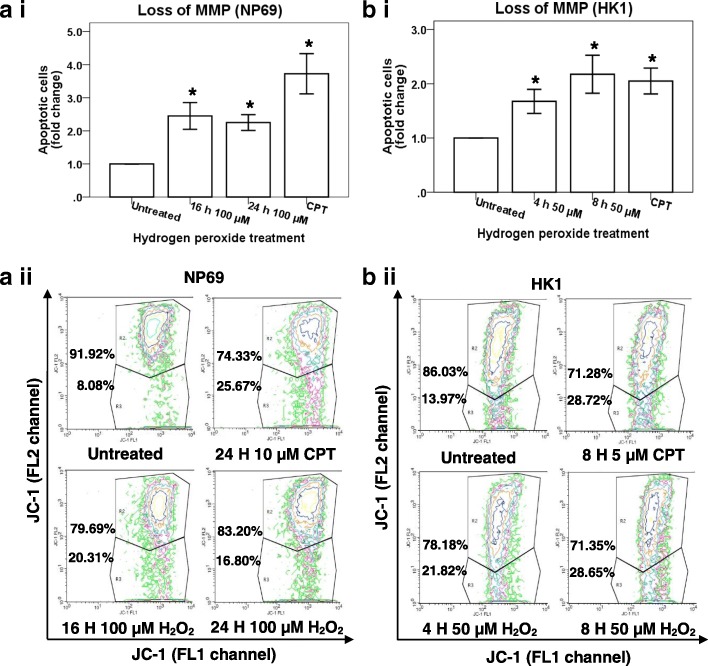
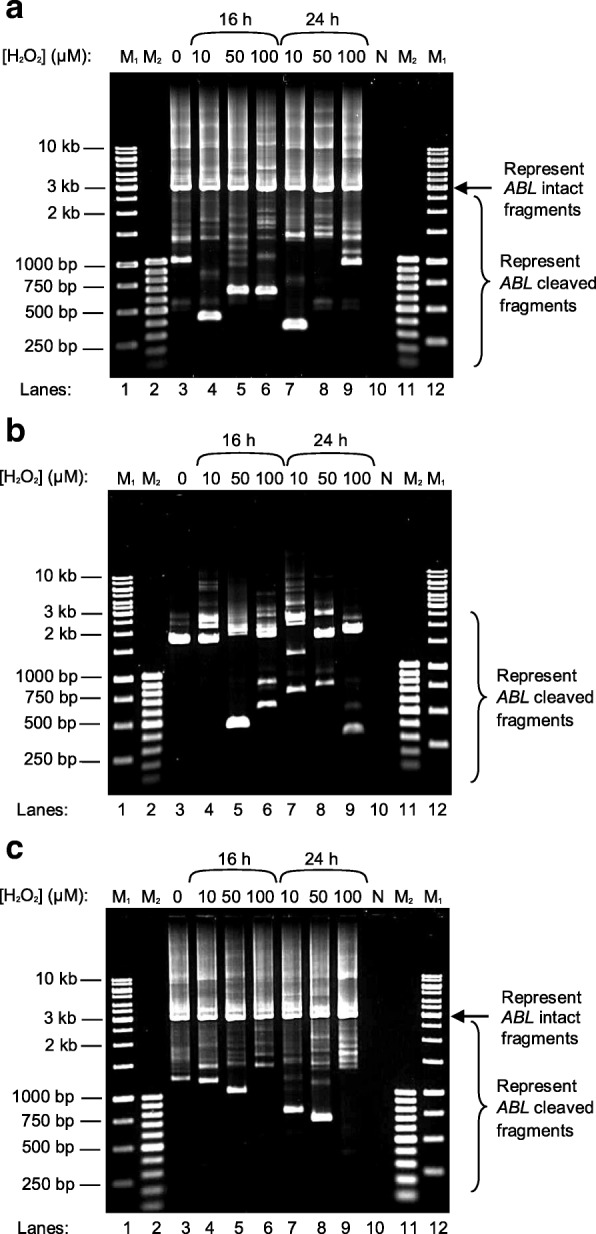
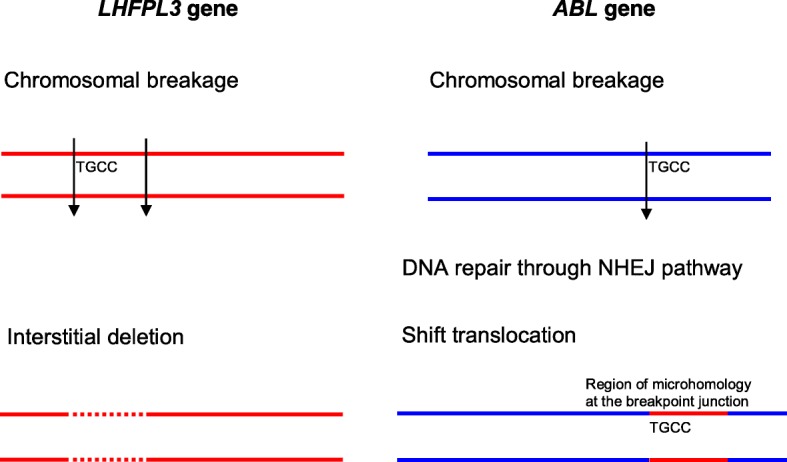
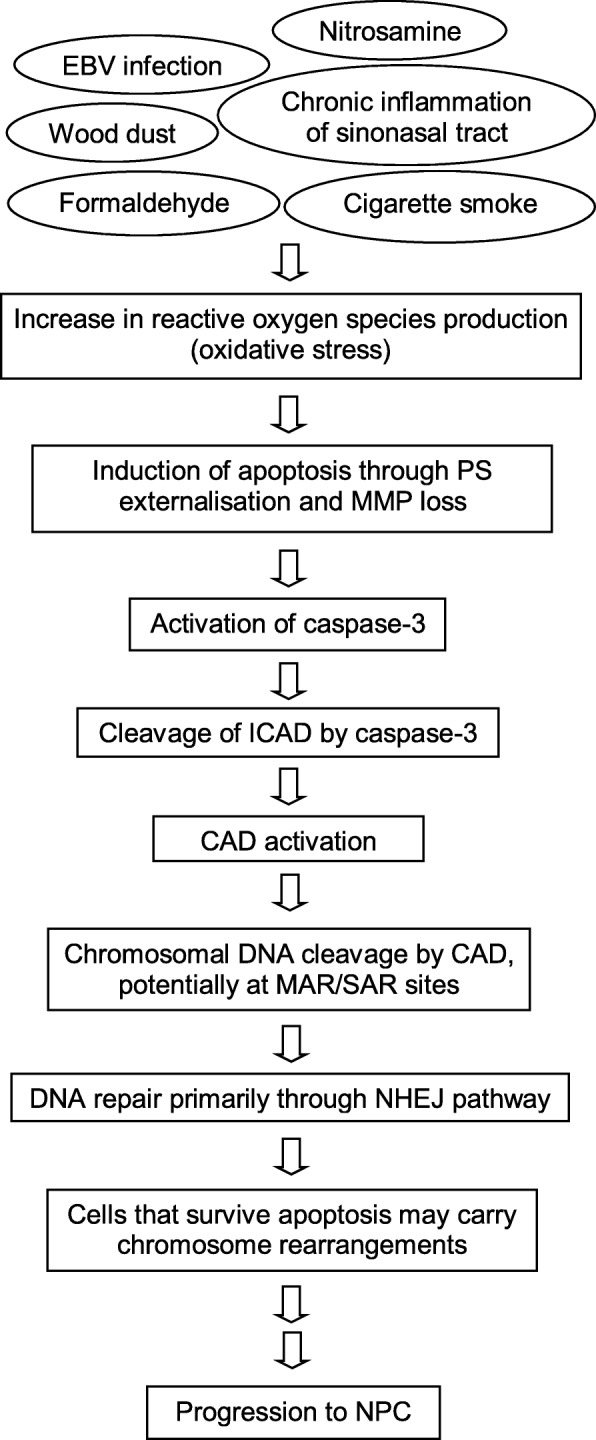
Background: The mechanism underlying chromosome rearrangement in nasopharyngeal carcinoma (NPC) remains elusive. It is known that most of the aetiological factors of NPC trigger oxidative stress. Oxidative stress is a potent apoptotic inducer. During apoptosis, chromatin cleavage and DNA fragmentation occur. However, cells may undergo DNA repair and survive apoptosis. Non-homologous end joining (NHEJ) pathway has been known as the primary DNA repair system in human cells. The NHEJ process may repair DNA ends without any homology, although region of microhomology (a few nucleotides) is usually utilised by this DNA repair system. Cells that evade apoptosis via erroneous DNA repair may carry chromosomal aberration. Apoptotic nuclease was found to be associated with nuclear matrix during apoptosis. Matrix association region/scaffold attachment region (MAR/SAR) is the binding site of the chromosomal DNA loop structure to the nuclear matrix. When apoptotic nuclease is associated with nuclear matrix during apoptosis, it potentially cleaves at MAR/SAR. Cells that survive apoptosis via compromised DNA repair may carry chromosome rearrangement contributing to NPC tumourigenesis. The Abelson murine leukaemia (ABL) gene at 9q34 was targeted in this study as 9q34 is a common region of loss in NPC. This study aimed to identify the chromosome breakages and/or rearrangements in the ABL gene in cells undergoing oxidative stress-induced apoptosis.

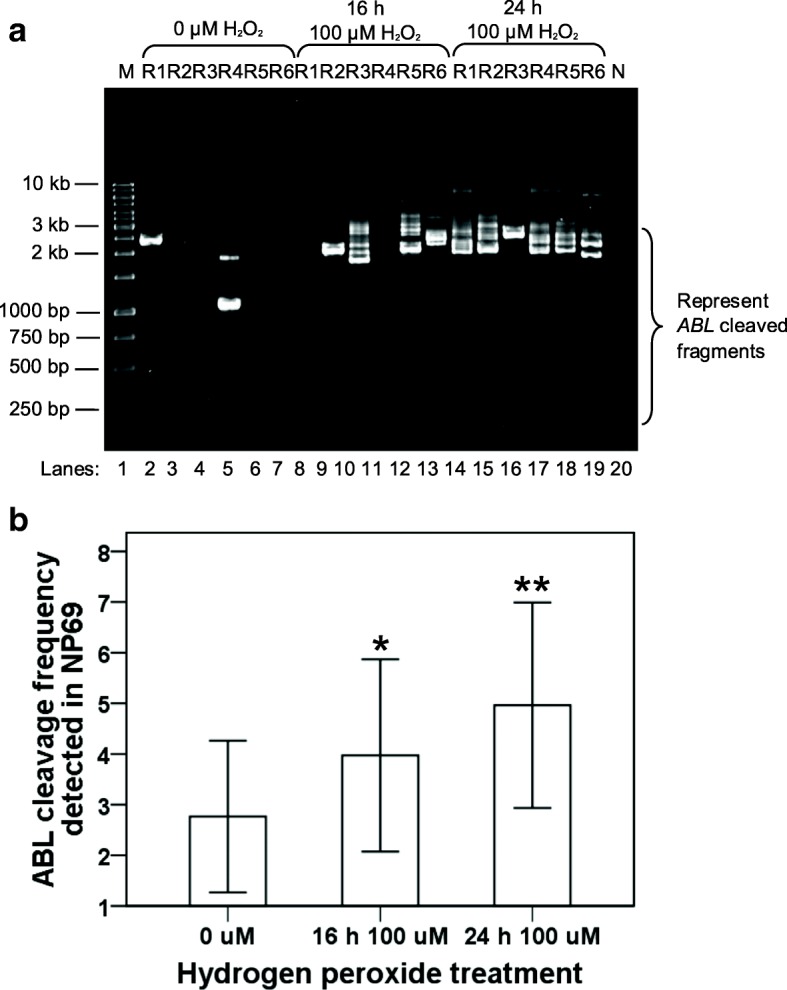
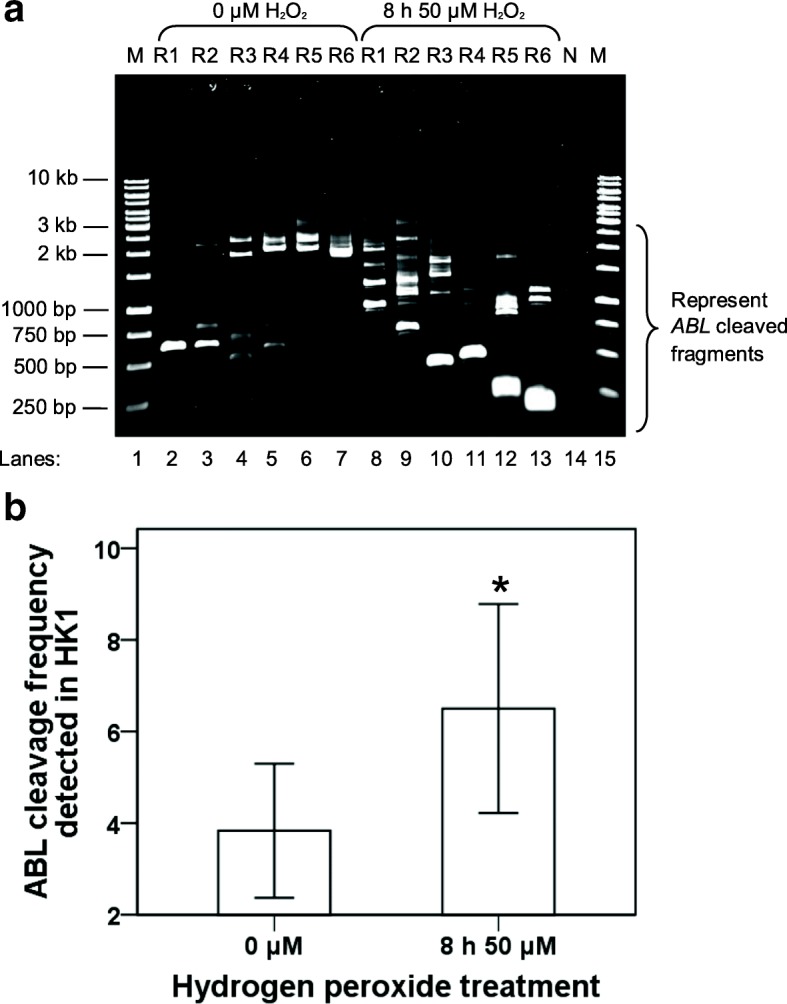
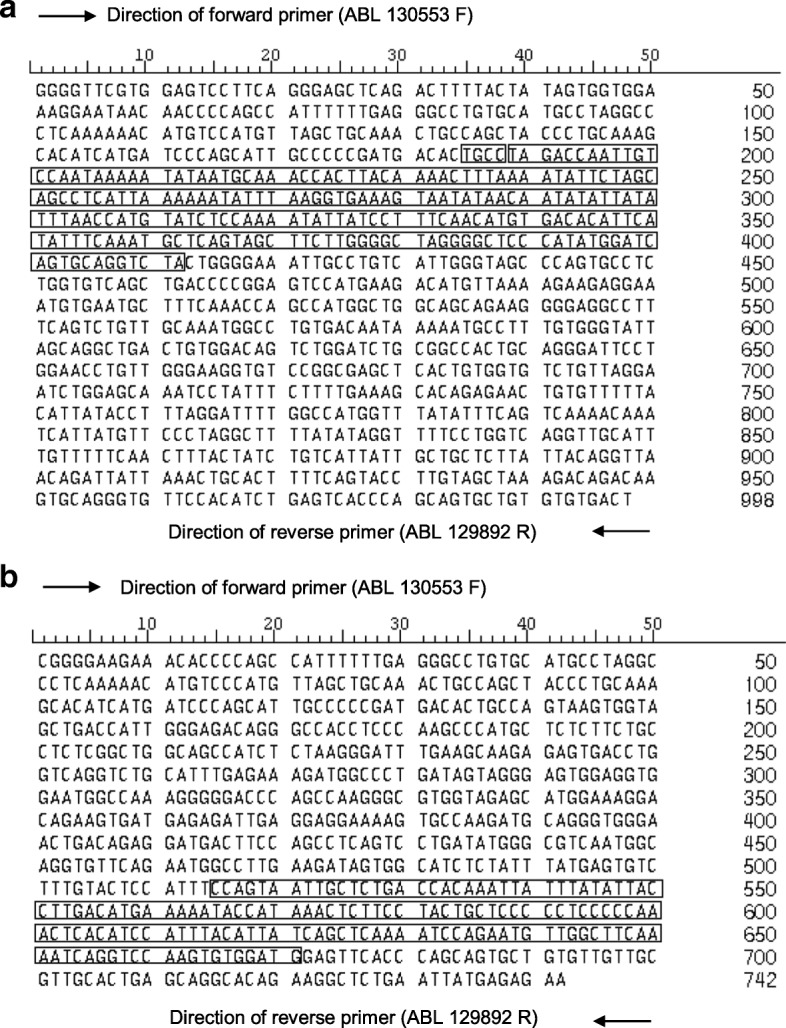
Results: In the present study, in silico prediction of MAR/SAR was performed in the ABL gene. More than 80% of the predicted MAR/SAR sites are closely associated with previously reported patient breakpoint cluster regions (BCR). By using inverse polymerase chain reaction (IPCR), we demonstrated that hydrogen peroxide (H2O2)-induced apoptosis in normal nasopharyngeal epithelial and NPC cells led to chromosomal breakages within the ABL BCR that contains a MAR/SAR. Intriguingly, we detected two translocations in H2O2-treated cells. Region of microhomology was found at the translocation junctions. This observation is consistent with the operation of microhomology-mediated NHEJ.

Conclusions: Our findings suggested that oxidative stress-induced apoptosis may participate in chromosome rearrangements of NPC. A revised model for oxidative stress-induced apoptosis mediating chromosome rearrangement in NPC is proposed.

Keywords: ABL; Apoptosis; H2O2; MAR/SAR; NPC; Oxidative stress.


Conflict of interest statement

Ethics approval and consent to participate

Not applicable.

Consent for publication

Not applicable.

Competing interests

The authors declare that they have no competing interests.

Publisher’s Note

Springer Nature remains neutral with regard to jurisdictional claims in published maps and institutional affiliations.

Figures

Fig. 1
Fig. 1
Distribution of potential MAR/SAR sites predicted in the ABL gene. The ABL genomic map from nucleotide positions 601-174330 is illustrated above [Ensembl:ENSG00000097007]. The locations of exons 1 to 11 are shown. Green boxes represent the three previously reported patient breakpoints cluster regions which are designated as BCRA, BCRB and BCRC. Yellow box shows the previously biochemically extracted MAR/SAR which is designated as SAR1 [77]. Yellow arrows represent the potential MAR/SARs predicted by MRS. Clusters of more than one MRS within close proximity are regarded as a single potential MAR/SAR site. For instance, there were two MRSs predicted in BCRB, however, they were regarded as a single potential MAR/SAR site (MAR/SAR 3) because they were found in close proximity. There was one MAR/SAR site (MAR/SAR 9) predicted in the experimentally isolated SAR1
Fig. 2
Fig. 2
Flow cytometric analysis of phosphatidylserine (PS) externalisation. NP69 cells were either left untreated or treated with 100 μM of H2O2 for 16 and 24 h while HK1 cells were either left untreated or treated with 50 μM for 4 and 8 h. Cells treated with CPT was included as a positive control. The percentage of cells showing PS externalisation was determined in H2O2-treated NP69 cells (a i) and HK1 cells (b i). Means and SD of three independent experiments performed in duplicate are shown. Data are expressed as fold change normalised to untreated control. *p < 0.01, **p < 0.001 (Student’s t test). The representative dot plot diagrams indicating the apoptotic populations of (a ii) H2O2-treated NP69 cells and (b ii) H2O2-treated HK1 cells are shown. The lower left quadrants indicate healthy cells; the lower right quadrants indicate cells in early apoptosis; the upper right quadrants indicate cells in late apoptosis and necrosis
Fig. 3
Fig. 3
Flow cytometric analysis of mitochondrial membrane potential (MMP) loss. NP69 cells were either left untreated or treated with 100 μM of H2O2 for 16 and 24 h while HK1 cells were either left untreated or treated with 50 μM for 4 and 8 h. Cells treated with CPT was included as a positive control. The percentage of cells showing MMP loss was determined in H2O2-treated NP69 cells (a i) and HK1 cells (b i). Means and SD of two independent experiments performed in duplicate are shown. Data are expressed as fold change normalised to untreated control. *p < 0.01 (Student’s t test). The representative contour plot diagrams indicating the apoptotic populations of (a ii) H2O2-treated NP69 cells and (b ii) H2O2-treated HK1 cells are shown. The upper quadrants indicate healthy cells whereas the lower quadrants indicate cells expressing MMP loss
Fig. 4
Fig. 4
Nested IPCR detection of DNA breakages within the ABL gene in H2O2-treated NP69. NP69 cells at 30–40% confluency were either untreated (lane 3) or treated with 10 μM (lanes 4 and 7), 50 μM (lanes 5 and 8) or 100 μM (lanes 6 and 9) of H2O2 for 16 h (lanes 4–6) and 24 h (lanes 7–9). Genomic DNA was isolated and manipulated for nested IPCR. In the manipulation for nested IPCR, the DNA samples were subjected to digestion with Age I (a), double digestion with Age I and EcoR I (b) or double digestion with Age I and BsaA I (c). The IPCR products were analysed on 1% agarose gel. Side arrows in panels a and c indicate the position of the 3 kb IPCR bands resulting from the amplification of the intact ABL gene. Side brackets in panels a, b and c indicate the possible IPCR bands from the ABL cleaved fragments. Negative control for PCR was included (lane 10). This IPCR result is representative of 2 repeats with similar results. M1: 1 kb DNA ladder. M2: 100 bp DNA ladder
Fig. 5
Fig. 5
Nested IPCR detection of DNA breakages within the ABL gene in H2O2-treated HK1. HK1 cells were seeded in 60-mm culture dishes and were grown to optimal density (60–70% confluency). The cells were then either untreated (lane 3) or treated with 1 μM (lanes 4, 7, 10 and 13), 10 μM (lanes 5, 8, 11 and 14) or 50 μM (lanes 6, 9, 12 and 15) of H2O2 for 2 h (lanes 4–6), 4 h (lanes 7–9), 6 h (lanes 10–12) and 8 h (lanes 13–15). Genomic DNA was isolated and manipulated for nested IPCR. In the modification for nested IPCR, the DNA samples were either subjected to digestion with Age I (a) or double digestion with Age I and EcoR I (b). The IPCR products were analysed on 1% agarose gel. Side arrow in panel a indicates the position of the 3 kb IPCR bands resulting from the amplification of the intact ABL gene. Side brackets in both panels a and b indicate the possible IPCR bands from the ABL cleaved fragments. Negative control for PCR was included (lane 16). This IPCR result is representative of 2 repeats with similar results. M1: 1 kb DNA ladder. M2: 100 bp DNA ladder
Fig. 6
Fig. 6
IPCR analysis of H2O2-induced chromosome breaks within the ABL gene in NP69 cells. a IPCR result obtained from H2O2-treated NP69 cells. NP69 cells were either untreated (lanes 2–7) or treated with 100 μM of H2O2 for 16 h (lanes 8–13) and 24 h (lanes 14–19). Genomic DNA was isolated and manipulated for nested IPCR. Double digestion with Age I and EcoR I was employed to eliminate competition of the intact fragments in the amplification process. Each cell sample consisted of six replicates (R1–6) in the nested IPCR. The IPCR products were analysed on 1.0% agarose gel. Side bracket indicates the possible IPCR bands derived from the ABL cleaved chromosome. Negative control for PCR was included (Lane 20). M: 100 bp DNA ladder. b The average number of DNA cleavage detected within the ABL gene. The data was expressed as means and SD of three independent experiments. Each experiment consisted of 1–3 sets of IPCR. Each set of IPCR was performed in 4–7 IPCR replicates for each cell sample. *p < 0.01, **p < 0.001 (Student’s t test)
Fig. 7
Fig. 7
IPCR analysis of H2O2-induced chromosome breaks within the ABL gene in HK1 cells. a IPCR result obtained from H2O2-treated HK1 cells. HK1 cells were either untreated (lanes 2–7) or treated with 50 μM of H2O2 for 8 h (lanes 8–13). Genomic DNA was isolated and manipulated for nested IPCR. In the manipulation for nested IPCR, samples were subjected to double digestion with Age I and EcoR I to eliminate the competition of the intact fragments for amplification process. Each cell sample consisted of six replicates in nested IPCR. The IPCR products were analysed on 1.0% agarose gel. Side bracket indicates the possible IPCR bands derived from the ABL cleaved chromosome. Negative control for PCR was included (lane 14). M: 100 bp DNA ladder. b The average number of DNA cleavage detected within the ABL gene. The data was expressed as means and SD of three independent experiments. Each experiment consisted of 1–3 sets of IPCR. Each set of IPCR was performed in 6 IPCR replicates for each cell sample. *Pp< 0.001 (Student’s t test)
Fig. 8
Fig. 8
A map representing the positions of H2O2-induced chromosome breaks within the ABL gene. a The ABL genomic map from nucleotide positions 601-174330 is illustrated above [Ensembl:ENSG00000097007]. The locations of exons 1–11 are shown. The green boxes indicate the three previously identified patient breakpoints cluster regions which are designated as BCRA, BCRB and BCRC. The yellow box shows the previously biochemically extracted MAR/SAR which is indicated as SAR1 [77]. The yellow arrows represent the potential MAR/SARs predicted by MRS in this study. b The region of study (3.7 kb). Xba I (X), BsaA I (B), Age I (A) and EcoR I (E) restriction sites are shown. The green and blue arrows represent the primers used in the first and second rounds of nested IPCR, respectively. The breakpoints identified in H2O2-treated HK1 and NP69 cells are indicated by the green and red vertical lines, respectively. All chromosome breaks were mapped within SAR1
Fig. 9
Fig. 9
Shift translocations detected in H2O2-treated NP69 cells. a Treatment of NP69 with 100 μM of H2O2 for 16 h resulted in shift translocation. The DNA sequences 1–184 and 413–998 (without the box) represent the sequence derived from the ABL gene. The DNA sequence 185–412 (within the box) represents the sequence derived from the LHFPL3 gene which locates at chromosome 7. Region of microhomology (185–188, TGCC) was found at the breakpoint junctions. The translocated fragment (228 bp) of LHFPL3 gene is corresponding to coordinates 108,006–108,234 [Ensembl:ENSG00000187416]. b Treatment of NP69 with 10 μM of H2O2 for 24 h resulted in shift translocation. The DNA sequences 1–524 and 672–742 (without the box) represent the sequence derived from the ABL gene. The DNA sequence 525–671 (within the box) represents the sequence of the fragment translocated to the ABL gene. This translocated fragment (147 bp) is derived from chromosome 5. The disabled homologue 2 (DAB) gene is 1,263,556 bp at the 5′ end of this translocated fragment while a gene encoding for a hypothetical protein is 22,122 bp at the 3′ end
Fig. 10
Fig. 10
A potential model for the shift translocation of the LHFPL3 gene. During oxidative stress-induced apoptosis, chromosomal breakages occur within both the LHFPL3 (located at chromosome 7q22) and ABL (located at chromosome 9q34) genes. Following that, interstitial deletion occurs within the LHFPL3 gene. When the cells try to survive apoptosis, DNA repair takes place. By utilising the region of microhomology, TGCC, that was found at the breakpoint junctions of both the LHFPL3 and ABL genes, the two DNA ends were joined. Subsequently, cells that survive apoptosis may carry the ABL gene with the shift translocation of a segment of the LHFPL3 gene
Fig. 11
Fig. 11
A revised model for oxidative stress-induced chromosome rearrangement in NPC
Fig. 12
Fig. 12
A flowchart showing the manipulation steps in the preparation of genomic DNA for IPCR. The genomic DNA was subjected to RE digestions, Klenow fill-in and ligation prior to IPCR as reported before [80]

References

    1. Shanmugaratnam K. Histological typing of nasopharyngeal carcinoma. IARC Sci Publ. 1978;20:3–12. - PubMed
    1. Hirayama T. Descriptive and analytical epidemiology of nasopharyngeal cancer. IARC Sci Publ. 1978;20:167–89. - PubMed
    1. Chang ET, Adami HO. The enigmatic epidemiology of nasopharyngeal carcinoma. Cancer Epidemiol Biomark Prev. 2006;15:1765–1777. doi: 10.1158/1055-9965.EPI-06-0353. - DOI - PubMed
    1. Huang DP, Lo KW. Aetiological factors and pathogenesis. In: van Hasselt CA, Gibb AG, editors. Nasopharyngeal carcinoma. Hong Kong: The Chinese University Press; 1999. pp. 31–60.
    1. Devi BC, Pisani P, Tang TS, Parkin DM. High incidence of nasopharyngeal carcinoma in native people of Sarawak, Borneo Island. Cancer Epidemiol Biomarkers Prev. 2004;13:482–486. - PubMed

Publication types

LinkOut - more resources