

Characterization of Imprinted Genes in Rice Reveals Conservation of Regulation and Imprinting with Other Plant Species
- PMID: 29914891
- PMCID: PMC6084669
- DOI: 10.1104/pp.17.01621
Characterization of Imprinted Genes in Rice Reveals Conservation of Regulation and Imprinting with Other Plant Species
Abstract
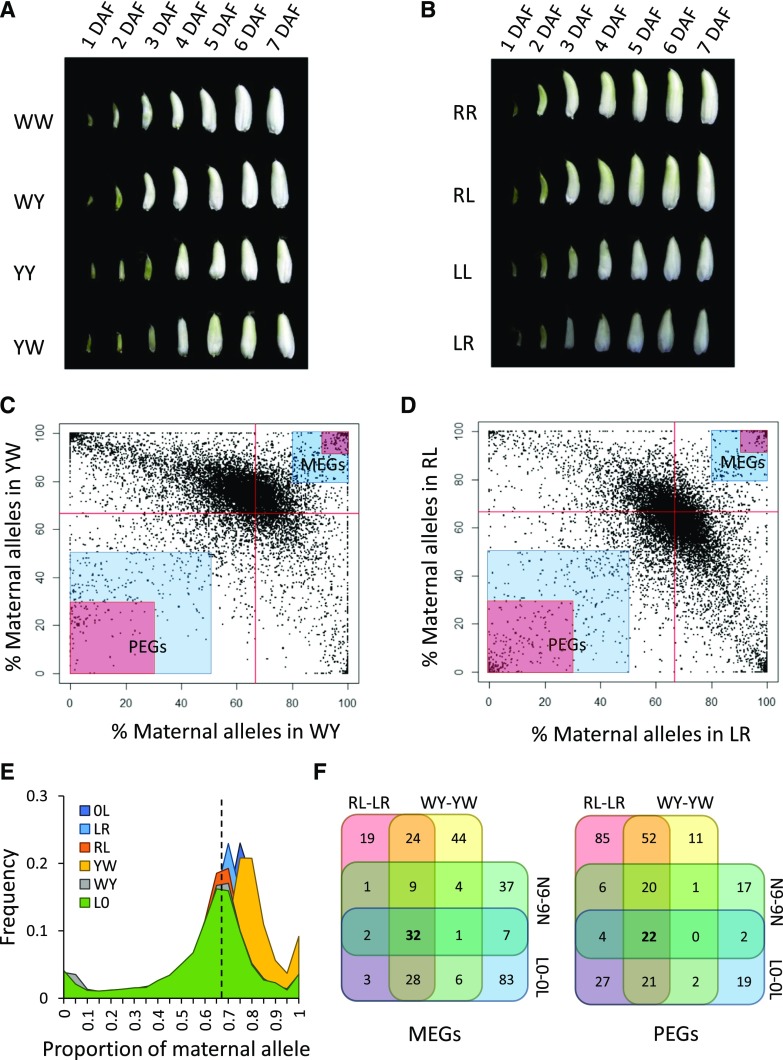
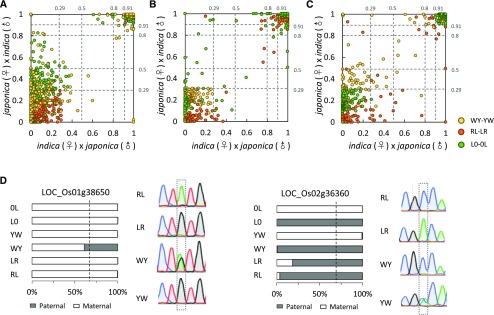
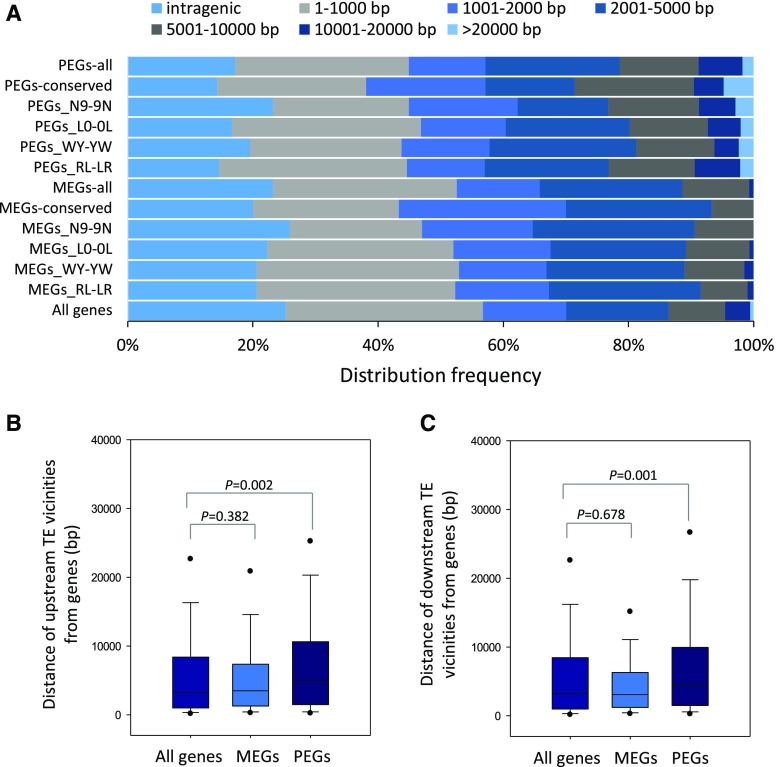
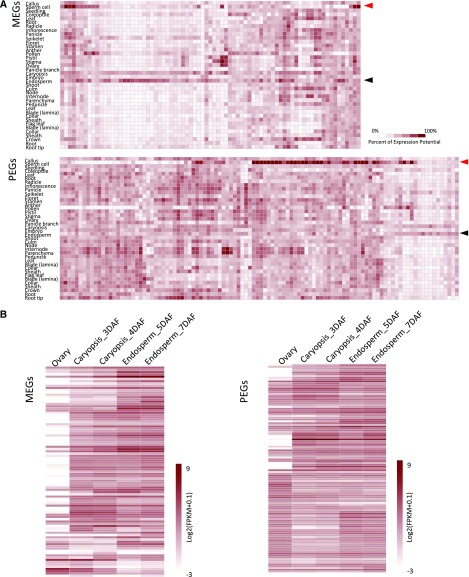
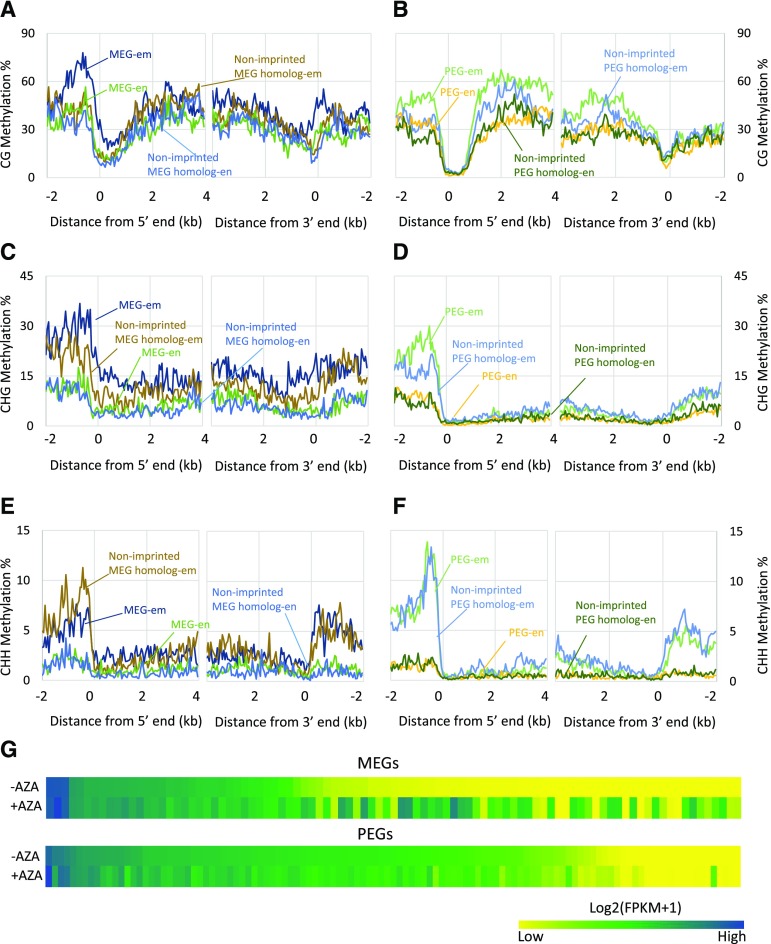
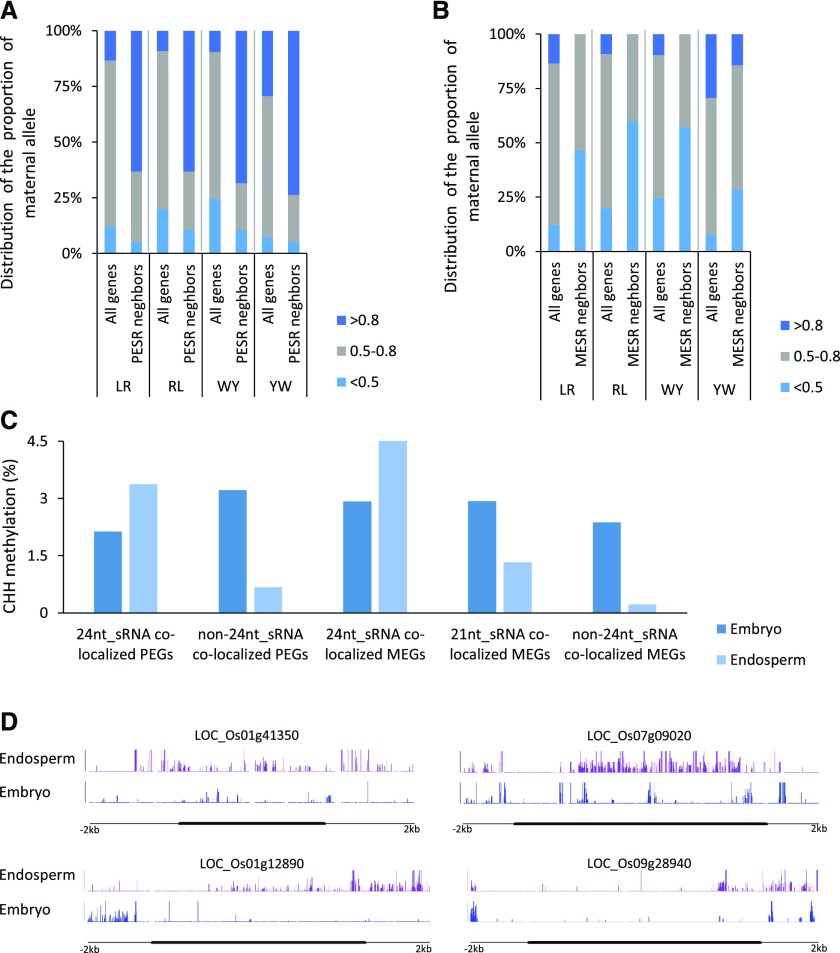
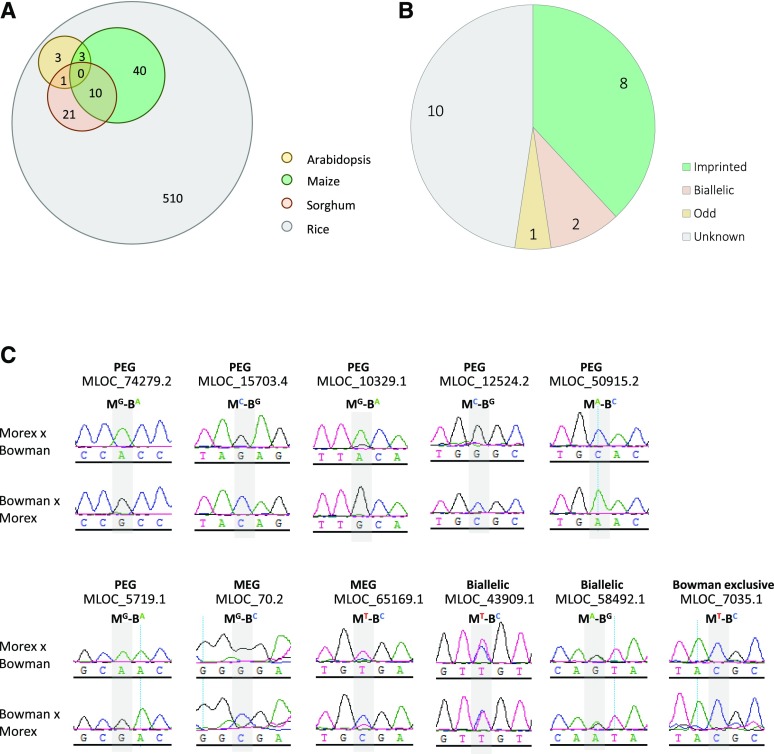
Genomic imprinting is an epigenetic phenomenon by which certain genes display differential expression in a parent-of-origin-dependent manner. Hundreds of imprinted genes have been identified from several plant species. Here, we identified, with a high level of confidence, 208 imprinted gene candidates from rice (Oryza sativa). Imprinted genes of rice showed limited association with the transposable elements, which contrasts with findings from Arabidopsis (Arabidopsis thaliana). Generally, imprinting in rice is conserved within a species, but intraspecific variation also was detected. The imprinted rice genes do not show signatures of selection, which suggests that domestication has had a limited evolutionary consequence on genomic imprinting. Although conservation of imprinting in plants is limited, we show that some loci are imprinted in several different species. Moreover, our results suggest that different types of epigenetic regulation can be established either before or after fertilization. Imprinted 24-nucleotide small RNAs and their neighboring genes tend to express alleles from different parents. This association was not observed between 21-nucleotide small RNAs and their neighboring genes. Together, our findings suggest that the regulation of imprinting can be diverse, and genomic imprinting has evolutionary and biological significance.
© 2018 American Society of Plant Biologists. All rights reserved.
Figures

Similar articles
-
Genomic imprinting: insights from plants.Annu Rev Genet. 2013;47:187-208. doi: 10.1146/annurev-genet-110711-155527. Epub 2013 Aug 30. Annu Rev Genet. 2013. PMID: 24016190 Review.
-
Divergence among rice cultivars reveals roles for transposition and epimutation in ongoing evolution of genomic imprinting.Proc Natl Acad Sci U S A. 2021 Jul 20;118(29):e2104445118. doi: 10.1073/pnas.2104445118. Proc Natl Acad Sci U S A. 2021. PMID: 34272287 Free PMC article.
-
A genome-wide survey of imprinted genes in rice seeds reveals imprinting primarily occurs in the endosperm.PLoS Genet. 2011 Jun;7(6):e1002125. doi: 10.1371/journal.pgen.1002125. Epub 2011 Jun 23. PLoS Genet. 2011. PMID: 21731498 Free PMC article.
-
Conserved Imprinted Genes between Intra-Subspecies and Inter-Subspecies Are Involved in Energy Metabolism and Seed Development in Rice.Int J Mol Sci. 2020 Dec 17;21(24):9618. doi: 10.3390/ijms21249618. Int J Mol Sci. 2020. PMID: 33348666 Free PMC article.
-
Epigenetic mechanisms underlying genomic imprinting in plants.Annu Rev Plant Biol. 2012;63:331-52. doi: 10.1146/annurev-arplant-042811-105514. Epub 2012 Jan 30. Annu Rev Plant Biol. 2012. PMID: 22404470 Review.
Cited by
-
Identification of Imprinted Genes Based on Homology: An Example of Fragaria vesca.Genes (Basel). 2021 Mar 8;12(3):380. doi: 10.3390/genes12030380. Genes (Basel). 2021. PMID: 33800118 Free PMC article.
-
Accurate determination of genotypic variance of cell wall characteristics of a Populus trichocarpa pedigree using high-throughput pyrolysis-molecular beam mass spectrometry.Biotechnol Biofuels. 2021 Mar 6;14(1):59. doi: 10.1186/s13068-021-01908-y. Biotechnol Biofuels. 2021. PMID: 33676543 Free PMC article.
-
Developmental Analysis of Mimulus Seed Transcriptomes Reveals Functional Gene Expression Clusters and Four Imprinted, Endosperm-Expressed Genes.Front Plant Sci. 2020 Feb 25;11:132. doi: 10.3389/fpls.2020.00132. eCollection 2020. Front Plant Sci. 2020. PMID: 32161609 Free PMC article.
-
The maternally expressed polycomb group gene OsEMF2a is essential for endosperm cellularization and imprinting in rice.Plant Commun. 2020 Jul 2;2(1):100092. doi: 10.1016/j.xplc.2020.100092. eCollection 2021 Jan 11. Plant Commun. 2020. PMID: 33511344 Free PMC article.
-
Postzygotic reproductive isolation established in the endosperm: mechanisms, drivers and relevance.Philos Trans R Soc Lond B Biol Sci. 2021 Jun 7;376(1826):20200118. doi: 10.1098/rstb.2020.0118. Epub 2021 Apr 19. Philos Trans R Soc Lond B Biol Sci. 2021. PMID: 33866810 Free PMC article. Review.
References
-
- Abu-Zaitoon YM, Bennett K, Normanly J, Nonhebel HM (2012) A large increase in IAA during development of rice grains correlates with the expression of tryptophan aminotransferase OsTAR1 and a grain-specific YUCCA. Physiol Plant 146: 487–499 - PubMed
-
- Anderson SN, Johnson CS, Jones DS, Conrad LJ, Gou X, Russell SD, Sundaresan V (2013) Transcriptomes of isolated Oryza sativa gametes characterized by deep sequencing: evidence for distinct sex-dependent chromatin and epigenetic states before fertilization. Plant J 76: 729–741 - PubMed
-
- Bernardi J, Lanubile A, Li QB, Kumar D, Kladnik A, Cook SD, Ross JJ, Marocco A, Chourey PS (2012) Impaired auxin biosynthesis in the defective endosperm18 mutant is due to mutational loss of expression in the ZmYuc1 gene encoding endosperm-specific YUCCA1 protein in maize. Plant Physiol 160: 1318–1328 - PMC - PubMed
-
- Bratzel F, Yang C, Angelova A, López-Torrejón G, Koch M, del Pozo JC, Calonje M (2012) Regulation of the new Arabidopsis imprinted gene AtBMI1C requires the interplay of different epigenetic mechanisms. Mol Plant 5: 260–269 - PubMed
Publication types
MeSH terms
Substances
LinkOut - more resources
Full Text Sources
Other Literature Sources
Molecular Biology Databases
