. 2018 Sep;238(3):177-186.
doi: 10.1530/JOE-18-0190. Epub 2018 Jun 18.

mTOR signaling in the arcuate nucleus of the hypothalamus mediates the anorectic action of estradiol

Affiliations

mTOR signaling in the arcuate nucleus of the hypothalamus mediates the anorectic action of estradiol

Ismael González-García et al. J Endocrinol. 2018 Sep.

Abstract

Current evidence suggests that estradiol (E2), the main ovarian steroid, modulates energy balance by regulating both feeding and energy expenditure at the central level, through the energy sensor AMP-activated protein kinase (AMPK). We hypothesized that the hypothalamic mechanistic target of rapamycin (mTOR) pathway, a well-established nutrient sensor and modulator of appetite and puberty, could also mediate the anorectic effect of E2. Our data showed that ovariectomy (OVX) elicited a marked downregulation of the mTOR signaling in the arcuate nucleus of the hypothalamus (ARC), an effect that was reversed by either E2 replacement or central estrogen receptor alpha (ERα) agonism. The significance of this molecular signaling was given by the genetic inactivation of S6 kinase B1 (S6K1, a key downstream mTOR effector) in the ARC, which prevented the E2-induced hypophagia and weight loss. Overall, these data indicate that E2 induces hypophagia through modulation of mTOR pathway in the ARC.

Keywords: estradiol; food intake; hypothalamus; mTOR; obesity.


Figures

Figure 1
Figure 1
Effect of ovariectomy on energy balance and mTOR pathway within the ARC. (A) Body weight change, (B) daily food intake, (C) representative Western blot auto-radiographic images and (D) ARC protein levels of mTOR pathway of Sham rats or OVX rats. n = 30–32 animals per group for body weight and food intake data; n = 7 animals per group for Western blot data. All data are expressed as mean ± s.e.m. *, ** and ***P < 0.05, 0.01 and 0.001 vs Sham. For the Western blot analysis, representative images for all proteins are shown. In the gel images, all the bands for each picture come always from the same gel, but they may be spliced for clarity; in such case, this is depicted as vertical black lines.
Figure 2
Figure 2
Effect of E2 replacement on energy balance and mTOR pathway within the ARC in OVX rats. (A) Body weight change, (B) daily food intake, (C) representative Western blot auto-radiographic images and (D) ARC protein levels of mTOR pathway of OVX rats SC treated with vehicle or E2. n = 8–10 animals per group for body weight and food intake data; n = 6–10 animals per group for Western blot data. All data are expressed as mean ± s.e.m. *, ** and ***P < 0.05, 0.01 and 0.001 vs OVX vehicle. For the Western blot analysis, representative images for all proteins are shown. In the gel images, all the bands for each picture come always from the same gel, but they may be spliced for clarity; in such case, this is depicted as vertical black lines.
Figure 3
Figure 3
Effect of central PPT on energy balance and mTOR pathway within the ARC in OVX rats. (A) Body weight change, (B) daily food intake, (C) representative Western blot auto-radiographic images and (D) ARC protein levels of mTOR pathway of OVX rats ICV treated with vehicle or PPT. n = 7–12 animals per group for body weight and food intake data; n = 7 animals per group for Western blot data. All data are expressed as mean ± s.e.m. *, ** and ***P < 0.05, 0.01 and 0.001 vs OVX vehicle. For the Western blot analysis, representative images for all proteins are shown. In the gel images, all the bands for each picture come always from the same gel, but they may be spliced for clarity; in such case, this is depicted as vertical black lines.
Figure 4
Figure 4
Effect of central Leu and E2 on energy balance in OVX rats. (A) Representative Western blot autoradiographic images and (B) densitometry measures of protein levels of pmTOR and mTOR in the ARC of OVX rats ICV treated with vehicle or Leu. (C) Body weight change and (D) daily food intake of OVX rats ICV treated with vehicle or Leu and/or SC treated with vehicle or E2; n = 6 animals per group for body weight, food intake and Western blot data. All data are expressed as mean ± s.e.m. *, ** and ***P < 0.05, P < 0.01 and 0.001 vs OVX vehicle; # P < 0.05 vs OVX E2. For the Western blot analysis, representative images for all proteins are shown. In the gel images, all the bands for each picture come always from the same gel, but they may be spliced for clarity; in such case, this is depicted as vertical black lines.
Figure 5
Figure 5
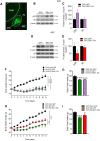
Effect of activation and down-regulation of mTOR pathway on the central actions of E2 on energy balance in OVX rats. (A) Direct fluorescence of GFP, (B and D) representative Western blot auto-radiographic images and (C and E) protein levels of pS6 and S6 in the ARC of OVX rats stereotaxically treated in the ARC with adenoviruses encoding GFP, S6K1-CA or S6K1-DN. (F) Body weight change and (G) daily food intake of OVX rats stereotaxically treated in the ARC with adenoviruses encoding GFP or S6K1-CA and SC treated with vehicle or E2. (H) Body weight change and (I) daily food intake of OVX rats stereotaxically treated in the ARC with adenoviruses encoding GFP or S6K1-DN and SC treated with vehicle or E2. n = 8–11 animals per group for body weight and food intake data; n = 7 animals per group for Western blot data. All data are expressed as mean ± s.e.m. * and ***P < 0.05 and 0.001 vs GFP or OVX Veh GFP; # P < 0.05 vs OVX E2 GFP. For the Western blot analysis, representative images for all proteins are shown. In the gel images, all the bands for each picture come always from the same gel, but they may be spliced for clarity; in such case, this is depicted as vertical black lines.

Similar articles

Cited by

References

    1. Acaz-Fonseca E, Sanchez-Gonzalez R, Azcoitia I, Arevalo MA, Garcia-Segura LM. 2014. Role of astrocytes in the neuroprotective actions of 17beta-estradiol and selective estrogen receptor modulators. Molecular and Cellular Endocrinology 389 48–57. (10.1016/j.mce.2014.01.009) - DOI - PubMed
    1. Acaz-Fonseca E, Avila-Rodriguez M, Garcia-Segura LM, Barreto GE. 2016. Regulation of astroglia by gonadal steroid hormones under physiological and pathological conditions. Progress in Neurobiology 144 5–26. (10.1016/j.pneurobio.2016.06.002) - DOI - PubMed
    1. Azcoitia I, Arevalo MA, De Nicola AF, Garcia-Segura LM. 2011. Neuroprotective actions of estradiol revisited. Trends in Endocrinology and Metabolism 22 467–473. (10.1016/j.tem.2011.08.002) - DOI - PubMed
    1. Blaustein JD, Wade GN. 1976. Ovarian influences on the meal patterns of female rats. Physiology and Behavior 17 201–208. (10.1016/0031-9384(76)90064-0) - DOI - PubMed
    1. Blouet C, Ono H, Schwartz GJ. 2008. Mediobasal hypothalamic p70 S6 kinase 1 modulates the control of energy homeostasis. Cell Metabolism 8 459–467. (10.1016/j.cmet.2008.10.004) - DOI - PMC - PubMed

Publication types