

doi: 10.1128/AAC.00669-18.
Print 2018 Sep.
External Evaluation of a Gentamicin Infant Population Pharmacokinetic Model Using Data from a National Electronic Health Record Database
Affiliations
- PMID: 29914947
- PMCID: PMC6125537
- DOI: 10.1128/AAC.00669-18
Item in Clipboard
External Evaluation of a Gentamicin Infant Population Pharmacokinetic Model Using Data from a National Electronic Health Record Database
Antimicrob Agents Chemother.
.
Abstract
Gentamicin is a common antibiotic used in neonates and infants. A recently published population pharmacokinetic (PK) model was developed using data from multiple studies, and the objective of our analyses was to evaluate the feasibility of using a national electronic health record (EHR) database for further external evaluation of this model. Our results suggest that, with proper data capture procedures, EHR data can serve as a potential data source for external evaluation of PK models.
Keywords: EHR; external evaluation; gentamicin; infant; pediatrics; pharmacokinetics.
Copyright © 2018 American Society for Microbiology.
Figures
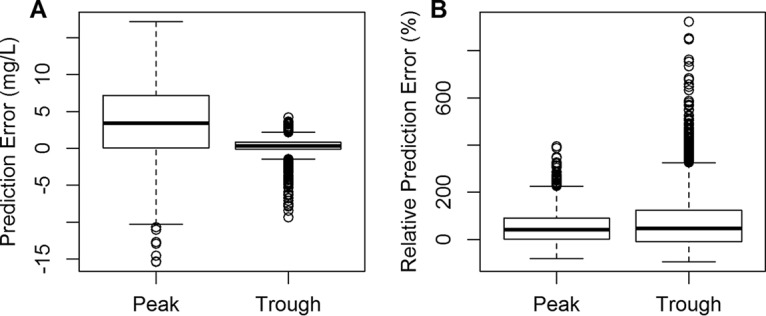
Box plots of prediction errors (A) and relative prediction errors (B) for peak and trough concentrations. The bottom and top of the box are the 25th and 75th percentiles, respectively, and the thick line in the middle of the box is the 50th percentile. The height of the box is the interquartile range (IQR). The upper whisker indicates the 75th percentile + 1.5·IQR, and the lower whisker indicates the 25th percentile − 1.5·IQR. Open circles are outlier points that are outside 1.5·IQR above the upper quartile and below the lower quartile.

VPC plot of gentamicin concentrations versus time after the last dose. The shaded regions denote the 95% confidence intervals around the 10th, 50th, and 90th percentiles of simulated concentrations. The dashed lines represent the 10th, 50th, and 90th percentiles for the observed data. The solid lines represent the 10th, 50th, and 90th percentiles for the predicted data. Open circles indicate the observed values.
References
Publication types
MeSH terms
Substances
Grants and funding
- HHSN267200700051C/HD/NICHD NIH HHS/United States
- K23 HD083465/HD/NICHD NIH HHS/United States
- HHSN275201000003C/HD/NICHD NIH HHS/United States
- K23 HD091398/HD/NICHD NIH HHS/United States
- KL2 TR001115/TR/NCATS NIH HHS/United States
- R01 FD005101/FD/FDA HHS/United States
- HHSN275201000003I/HD/NICHD NIH HHS/United States
- T32 GM086330/GM/NIGMS NIH HHS/United States
- K23 HD090239/HD/NICHD NIH HHS/United States
- UL1 TR001117/TR/NCATS NIH HHS/United States
- HHSN272201500006C/AI/NIAID NIH HHS/United States
- R01 HD076676/HD/NICHD NIH HHS/United States
- HHSN272201300017C/AI/NIAID NIH HHS/United States
- HHSN272201300017I/AI/NIAID NIH HHS/United States
- U01 FD004858/FD/FDA HHS/United States
- R34 HL124038/HL/NHLBI NIH HHS/United States
LinkOut - more resources
Full Text Sources
Other Literature Sources
Medical
