. 2018 Aug 27;62(9):e00380-18.
doi: 10.1128/AAC.00380-18. Print 2018 Sep.

Extinction of Zika Virus and Usutu Virus by Lethal Mutagenesis Reveals Different Patterns of Sensitivity to Three Mutagenic Drugs

Affiliations

Extinction of Zika Virus and Usutu Virus by Lethal Mutagenesis Reveals Different Patterns of Sensitivity to Three Mutagenic Drugs

Maria Rosaria Bassi et al. Antimicrob Agents Chemother. .

Abstract

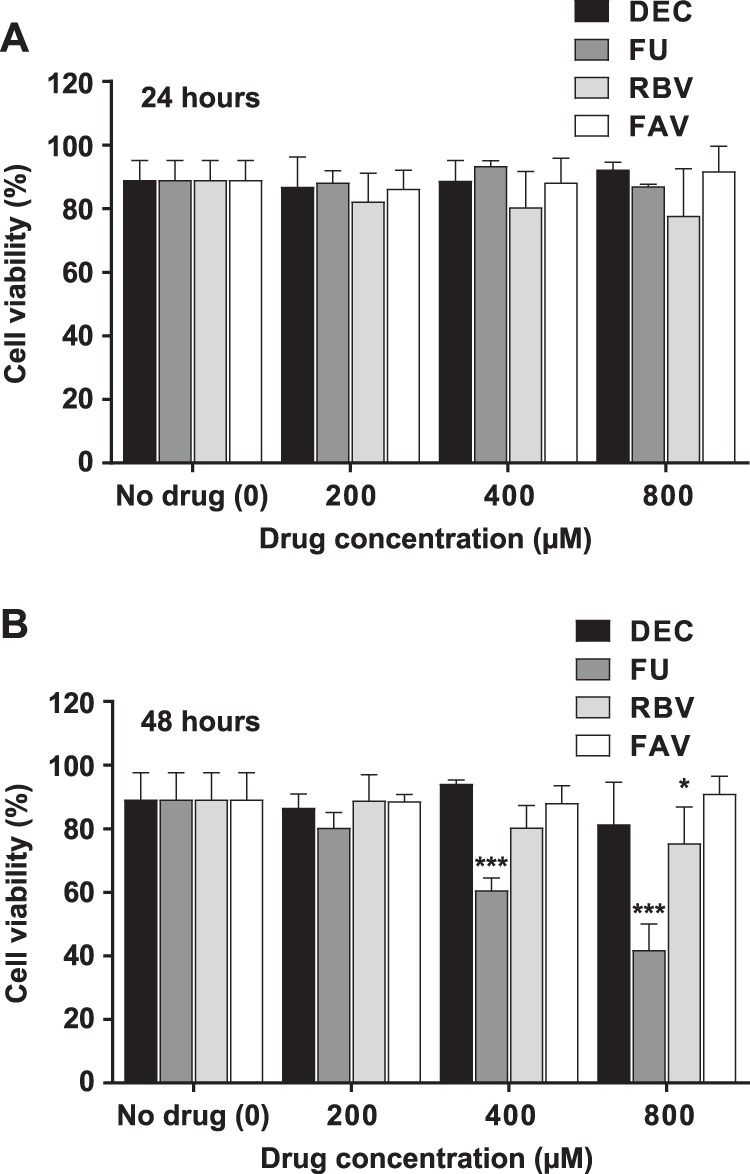
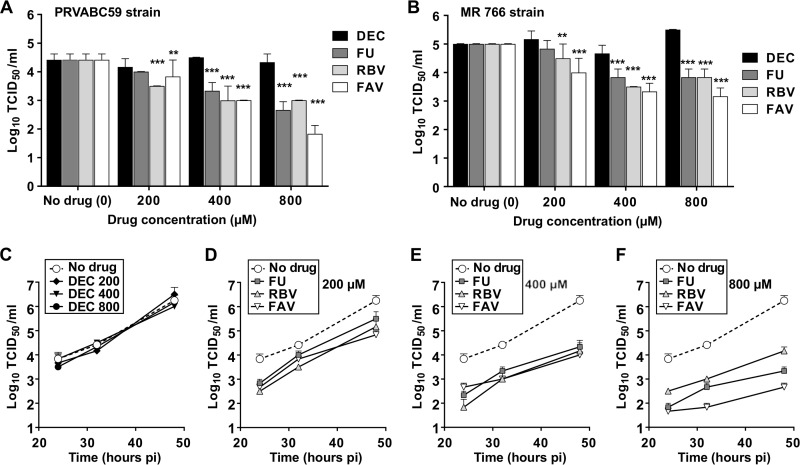
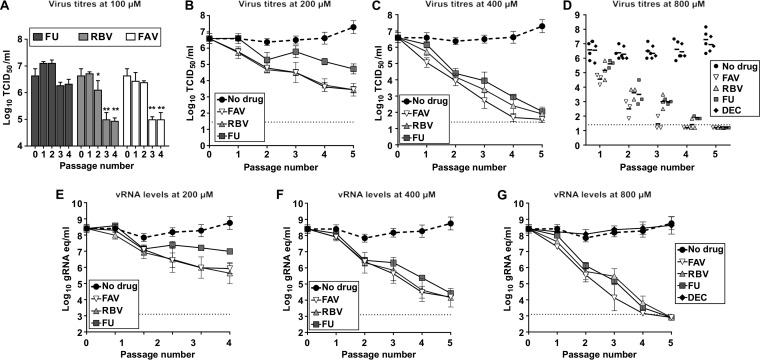
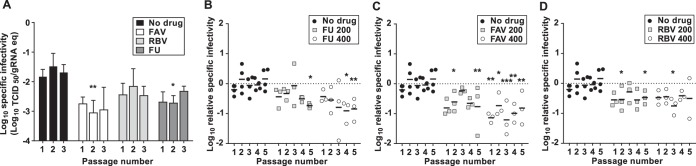
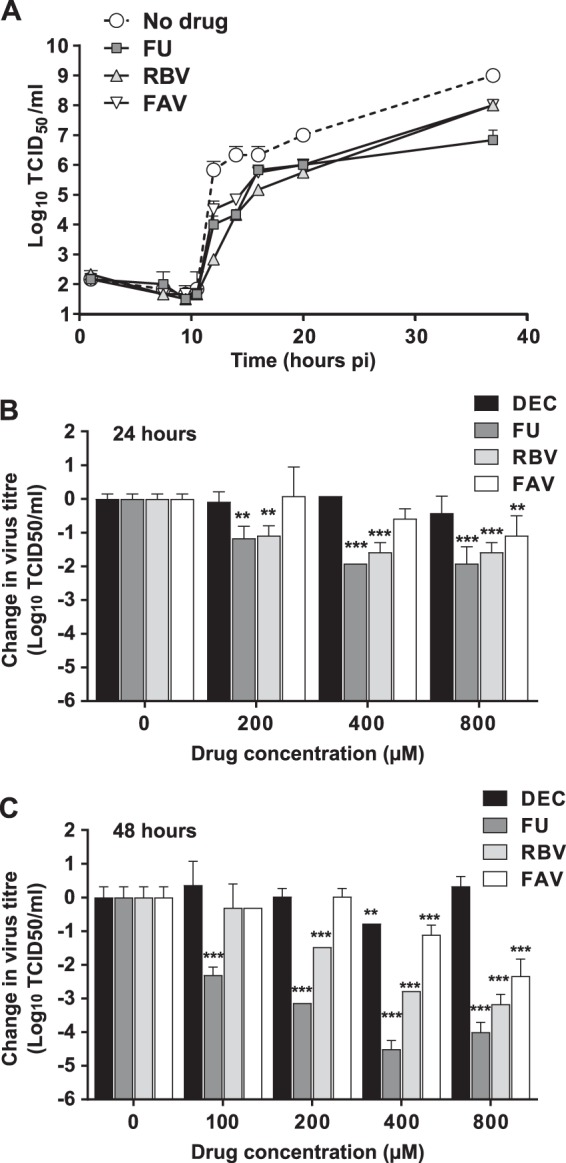
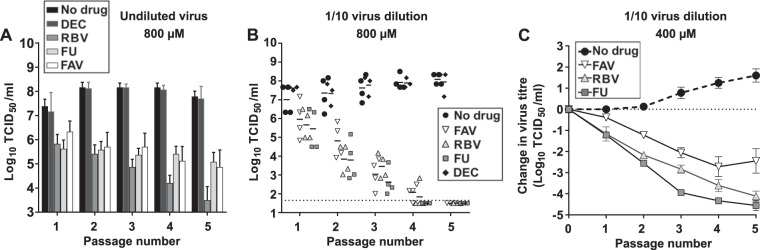
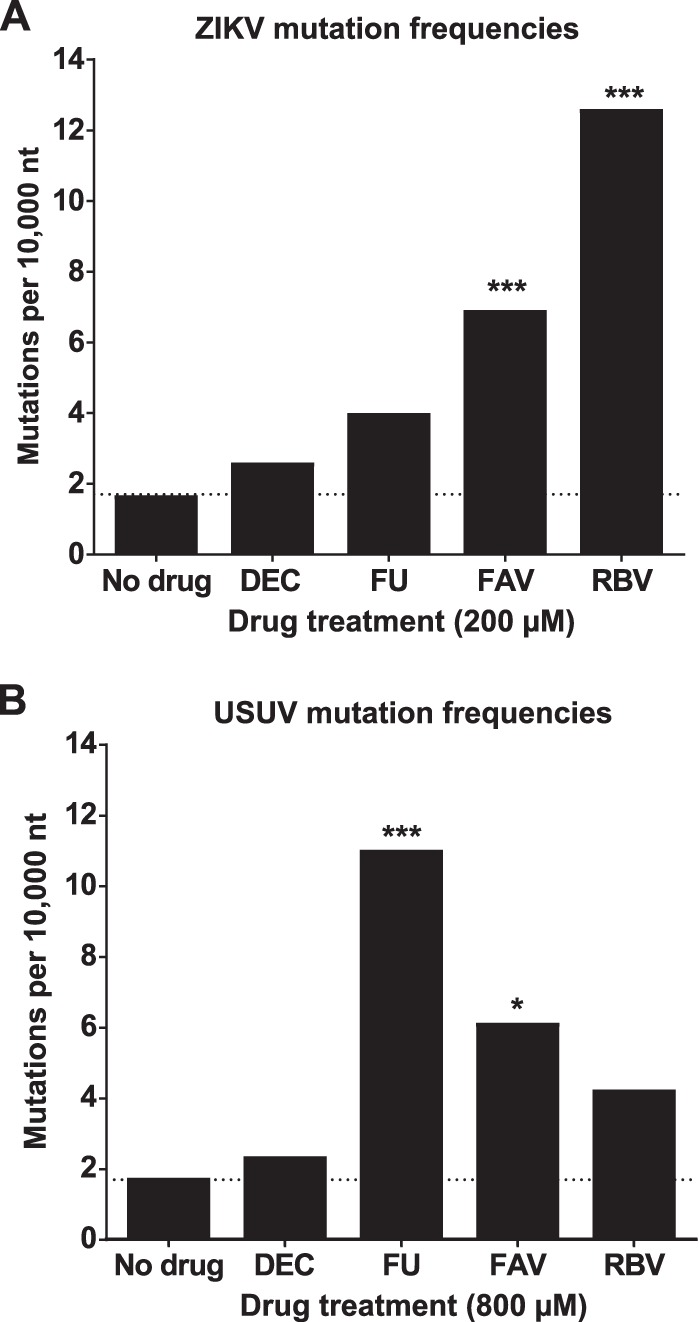
Flaviviruses constitute an increasing source of public health concern, with growing numbers of pathogens causing disease and geographic spread to temperate climates. Despite a large body of evidence supporting mutagenesis as a conceivable antiviral strategy, there are currently no data on the sensitivity to increased mutagenesis for Zika virus (ZIKV) and Usutu virus (USUV), two emerging flaviviral threats. In this study, we demonstrate that both viruses are sensitive to three ribonucleosides, favipiravir, ribavirin, and 5-fluorouracil, that have shown mutagenic activity against other RNA viruses while remaining unaffected by a mutagenic deoxyribonucleoside. Serial cell culture passages of ZIKV in the presence of these compounds resulted in the rapid extinction of infectivity, suggesting elevated sensitivity to mutagenesis. USUV extinction was achieved when a 10-fold dilution was applied between every passage, but not in experiments involving undiluted virus, indicating an overall lower susceptibility than ZIKV. Although the two viruses are inhibited by the same three drugs, ZIKV is relatively more susceptive to serial passage in the presence of purine analogues (favipiravir and ribavirin), while USUV replication is suppressed more efficiently by 5-fluorouracil. These differences in sensitivity typically correlate with the increases in the mutation frequencies observed in each nucleoside treatment. These results are relevant to the development of efficient therapies based on lethal mutagenesis and support the rational selection of different mutagenic nucleosides for each pathogen. We will discuss the implications of these results to the fidelity of flavivirus replication and the design of antiviral therapies based on lethal mutagenesis.

Keywords: 5-fluorouracil; Usutu virus; Zika virus; error threshold; favipiravir; flavivirus; lethal mutagenesis; mutation frequency; ribavirin.


Figures

FIG 1
FIG 1
Cell toxicity after treatment with nucleoside drug analogues. The toxicities of decitabine, 5-fluorouracil, favipiravir, and ribavirin upon Vero cells were scored using trypan blue under the microscope. Different concentrations of each drug (200 μM, 400 μM, and 800 μM) were applied to individual cell monolayers. Cell viability values for untreated cell cultures are included in the analysis (represented as 0 μM drug concentration). Cell viability was quantified by determining the proportion of live cells (white) relative to the total (white and blue) in each well. The percentages of live cells after 24 h (A) and 48 h (B) of exposure to each drug at the concentrations indicated are represented. Statistical significant differences in viability rates found in treated cells relative to untreated cell cultures are indicated (*, P < 0.05; ***, P < 0.001; 2-way ANOVA).
FIG 2
FIG 2
Favipiravir, ribavirin, and 5-fluorouracil inhibit ZIKV replication. (A and B) ZIKV titers obtained after infection of confluent Vero cell monolayers in the absence (drug concentration of 0 in the abscissa) or presence of each drug at the concentrations indicated. Cells were infected at an MOI of 0.01 and the supernatants collected at 32 h postinfection for titration. (A) ZIKV of Asian lineage (strain PRVABC59); (B) ZIKV African lineage (strain MR 766). Statistically significant differences are highlighted with asterisks (**, P < 0.01; ***, P < 0.001; 2-way ANOVA). Every value represents the average of the results from at least three biological replicas (± standard error of the mean [SEM]). Decitabine (DEC) values are shown as black bars, 5-fluorouracil (FU) as dark gray, ribavirin (RBV) as light gray, and favipiravir (FAV) as white bars. (C) Replication kinetics of ZIKV (Asian lineage, strain PRVABC59) in the presence of different concentrations of decitabine (DEC). Every value represents the average from virus titer determinations of at least three independent biological replicas (± SEM). Each symbol illustrates a different concentration of decitabine used in the assay, as follows: diamond, 200 μM; inverted triangle, 400 μM; black circle, 800 μM. (D to F) Replication kinetics of ZIKV (Asian lineage) in the presence of FU (dark-gray squares), RBV (light-gray triangles), and FAV (white inverted triangles) are compared to those in untreated infected cultures (white circles, dashed lines). Every value is obtained from the analysis of at least three biological replicas (± SEM). Each panel depicts viral replication kinetics in the presence of inhibitors at different concentrations, 200 μM (D), 400 μM (E), or 800 μM (F).
FIG 3
FIG 3
Favipiravir, ribavirin, and 5-fluorouracil cause efficient extinction of ZIKV during serial passages in cell culture. ZIKV was serially passaged in the absence (black circles, dashed lines), or in the presence of mutagenic drugs at 100 μM (A), 200 μM (B and E), 400 μM (C and F), or 800 μM (D and G). Three independent lineages of passages were performed for each drug and concentration tested. Serial passages were carried out with 100 μl of the cell culture supernatant recovered from the previous infection passage (corresponding to 1/10 of the total volume collected). The different graphs show the virus titers determined by TCID50 assay (A to D) and the genome copy equivalents obtained by quantitative PCR (qPCR) assays (E to G) that were found along serial passages of ZIKV. A black diamond represents ZIKV titers found in the supernatants of cultures treated with decitabine (DEC); dark-gray squares illustrate 5-fluorouracil (FU)-treated series; light gray triangles, ribavirin (RBV); and white inverted triangles, favipiravir (FAV). Every value represents the average of virus titrations or viral genome copy equivalents (gRNA eq) from at least three biological replicas obtained from independent series of passages (± SEM). In panel D, individual values obtained from each lineage are represented to better illustrate independent events of virus extinction.
FIG 4
FIG 4
ZIKV populations passaged in cell cultures treated with mutagenic compounds exhibit decreased specific infectivity. Specific infectivity values were calculated as the ratio of infectious virus units (TCID50) to viral genome copies (quantified by qPCR) in every biological sample. (A) Values found in untreated populations (black bars) or populations treated with FU (dark-gray bars), RBV (light gray), or FAV (white) during three passages in the presence of each drug at 800 μM. The values are the averages of the results from three independent biological replicas (± SEM). (B to D) The values found during 5 consecutive passages in untreated populations (black circles) or populations treated with each mutagen at different concentrations (200 μM [light-gray squares] or 400 μM [white circles]) are represented. Each graph illustrates independent values obtained in three independent lineages for each drug and concentration tested, 5-fluorouracil (B), ribavirin (C), and favipiravir (D). Statistically significant differences are represented (*, P < 0.05; **, P < 0.01; ***, P < 0.001; 2-way ANOVA).
FIG 5
FIG 5
Mutagenic nucleosides inhibit USUV replication in Vero cells. (A) Single-cycle replication kinetics of USUV treated with FU (dark-gray squares), RBV (light-gray triangles), or FAV (white inverted triangles) at 800 μM each, compared to that of untreated virus. Vero cells were inoculated at an MOI of 5 TCID50 per cell. Cellular supernatants were collected at different time points after infection. Every value in the graph is the average of the results from at least three biological replicas (± SEM). (B and C) USUV titers obtained after multiple rounds of virus replication in Vero cells in the absence (0) or presence of increasing concentrations of each drug. To ensure that the virus titers are the result of several rounds of replication, we employed a low MOI to infect the cells (0.1 or 0.01). Statistically significant differences are represented (**, P < 0.01; ***, P < 0.001; 2-way ANOVA). Each value in the graph is calculated as the average virus titer obtained from at least three independent biological replicates (± SEM). Virus titers obtained in infected cells treated with DEC are represented as black bars, titers in FU-treated cells are in dark gray, RBV cells are in light gray, and FAV cells are in white. (B) Vero cell monolayers were infected at an MOI of 0.1 and supernatants collected for titration at 24 h postinfection. (C) Supernatants of infected cells were collected for virus titer analysis at 48 h postinfection. To ensure that virus titers were obtained during the exponential-growth phase, we used an MOI of 0.01 instead of 0.1.
FIG 6
FIG 6
Extinction of USUV by nucleoside drugs requires viral sample dilution during serial transfers. (A) Passage of USUV in cells cultured in the presence of mutagenic drugs at 800 μM. In each passage, 100 μl of neat sample collected from the previous infection was applied to a new monolayer of cells. The bars are the average of titers obtained from four independent series. The values show the evolution of infectivity in cells treated with FU (gray), RBV (light gray), FAV (white), and DEC (dark gray), as well as in untreated cells (black). (B) FAV, RBV, and FU can lead USUV to extinction during serial passage of diluted viral samples. In each passage, 100 μl of a 10-fold diluted sample collected from the previous passage was applied to the following infection round. Different symbols in the graph show the evolution of infectivity in cells treated with FU (dark-gray squares), RBV (light-gray triangles), FAV (white inverted triangle), and DEC (black diamond) at a concentration of 800 μM. Virus titers in untreated USUV cultures are also represented (black circle). Individual values obtained from four independent lineages are represented to better illustrate independent events of virus extinction (two lineages for DEC). (C) Same as in panel B, but a concentration of 400 μM was used for each drug treatment on three independent lineages (DEC was not tested at this concentration).
FIG 7
FIG 7
Treatment with mutagenic nucleosides leads to an increase in the mutation frequencies of ZIKV and USUV populations. Mutation frequencies found in ZIKV (A) and USUV (B) populations are represented as the average number of nucleotide substitutions identified every 10,000 nucleotides analyzed. (A) To analyze the ZIKV mutation profile, we isolated individual sequences from samples recovered after five passages in the presence of 200 μM 5-fluorouracil (FU), favipiravir (FPV), or ribavirin (RBV), 800 μM decitabine (DEC), or in the absence of any drug. Total viral RNA was extracted and RT-PCR amplified, and the individual cDNA sequences were isolated by cloning in the pCR-Blunt cloning vector following procedures described in Materials and Methods. A total of 29,818, 23,120, 22,497, 27,476, and 20,558 nucleotides (nt) for populations recovered after passage in the presence of no drug, DEC, FU, FAV, and RBV, respectively, were sequenced. (B) Mutation frequencies in USUV populations isolated after 5 passages in the presence of each drug at 800 μM. The mutation frequency values are based in the analysis of a total of 45,337, 33,947, 34,453, 34,218, and 25,897 nucleotides in populations collected after passage in the presence of no drug, DEC, FU, FAV, and RBV, respectively. Statistically significant increases compared to untreated populations are indicated (*, P < 0.05; ***, P < 0.001; Mann-Whitney U test).

Similar articles

Cited by

References

    1. Murray NEA, Quam MB, Wilder-Smith A. 2013. Epidemiology of dengue: past, present and future prospects. Clin Epidemiol 5:299–309. doi:10.2147/CLEP.S34440. - DOI - PMC - PubMed
    1. Boeuf P, Drummer HE, Richards JS, Scoullar MJL, Beeson JG. 2016. The global threat of Zika virus to pregnancy: epidemiology, clinical perspectives, mechanisms, and impact. BMC Med 14:112. doi:10.1186/s12916-016-0660-0. - DOI - PMC - PubMed
    1. Dash AP, Bhatia R, Sunyoto T, Mourya DT. 2013. Emerging and re-emerging arboviral diseases in Southeast Asia. J Vector Borne Dis 50:77–84. - PubMed
    1. Bogoch II, Brady OJ, Kraemer MUG, German M, Creatore MI, Brent S, Watts AG, Hay SI, Kulkarni MA, Brownstein JS, Khan K. 2016. Potential for Zika virus introduction and transmission in resource-limited countries in Africa and the Asia-Pacific region: a modelling study. Lancet Infect Dis 16:1237–1245. doi:10.1016/S1473-3099(16)30270-5. - DOI - PMC - PubMed
    1. Petersen LR, Jamieson DJ, Powers AM, Honein MA. 2016. Zika virus. N Engl J Med 374:1552–1563. doi:10.1056/NEJMra1602113. - DOI - PubMed

Publication types

MeSH terms

Supplementary concepts