. 2018 Jul 3;115(27):E6291-E6300.
doi: 10.1073/pnas.1804701115. Epub 2018 Jun 18.

mRNA-binding protein tristetraprolin is essential for cardiac response to iron deficiency by regulating mitochondrial function

Affiliations

mRNA-binding protein tristetraprolin is essential for cardiac response to iron deficiency by regulating mitochondrial function

Tatsuya Sato et al. Proc Natl Acad Sci U S A. .

Abstract

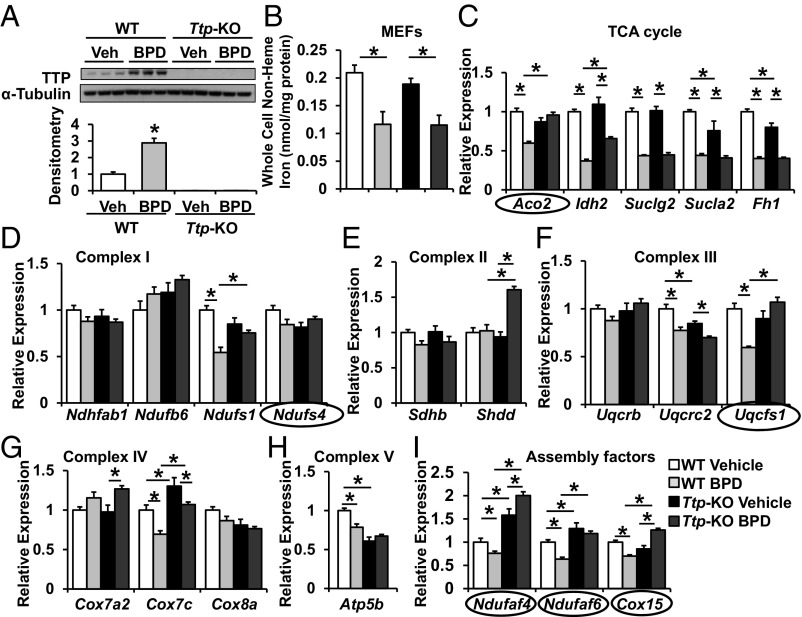
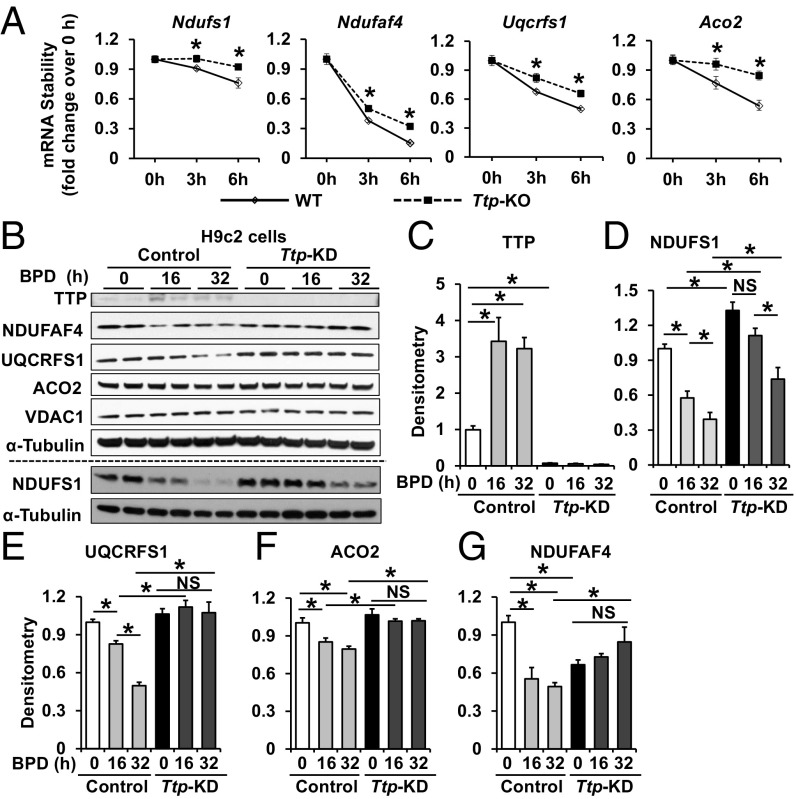
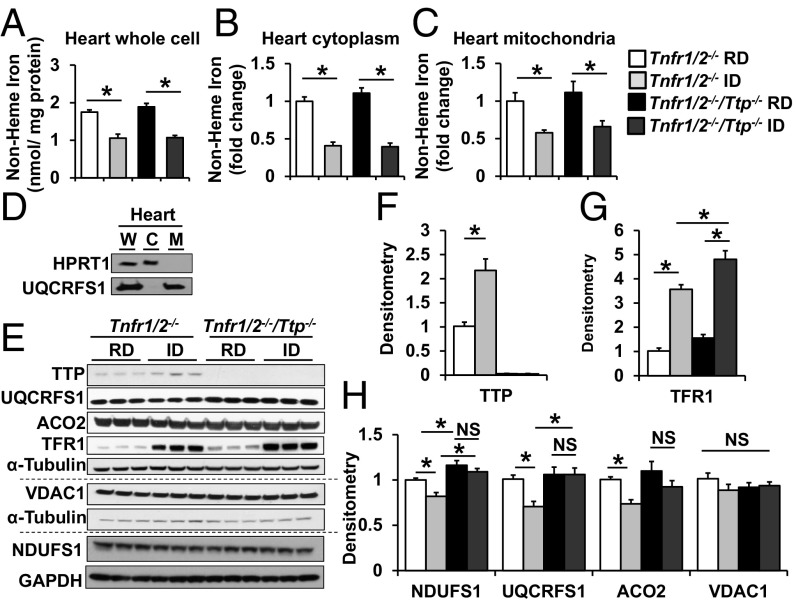
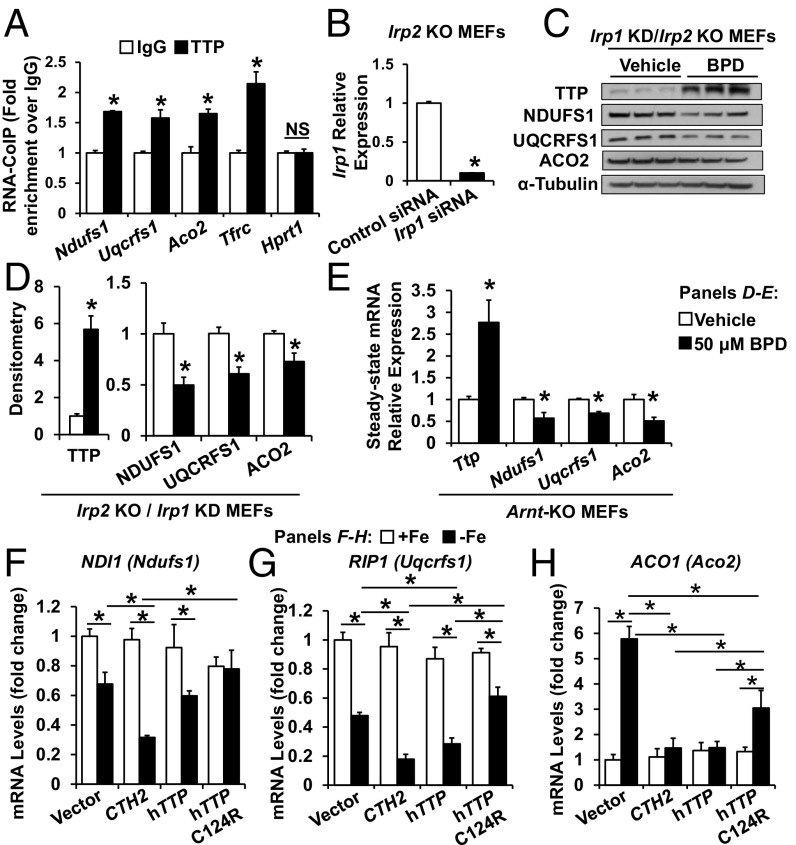
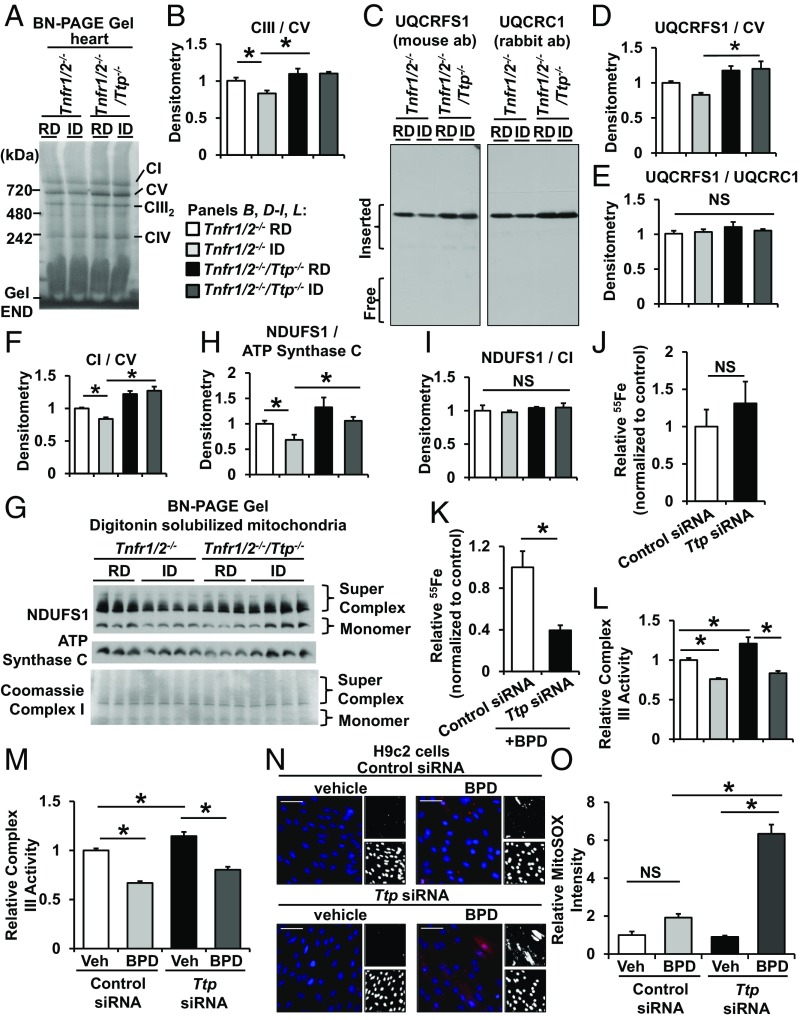
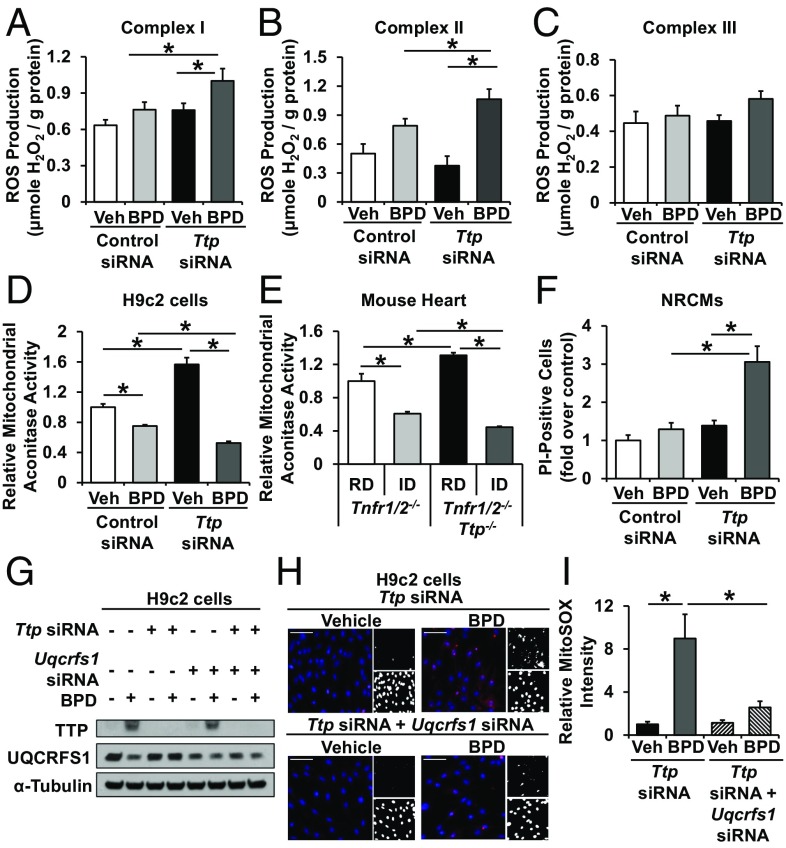
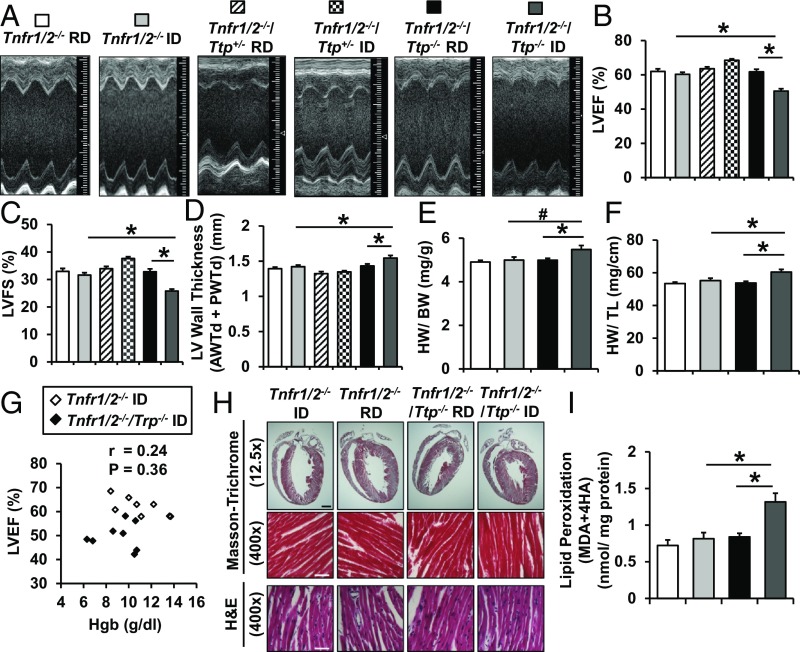
Cells respond to iron deficiency by activating iron-regulatory proteins to increase cellular iron uptake and availability. However, it is not clear how cells adapt to conditions when cellular iron uptake does not fully match iron demand. Here, we show that the mRNA-binding protein tristetraprolin (TTP) is induced by iron deficiency and degrades mRNAs of mitochondrial Fe/S-cluster-containing proteins, specifically Ndufs1 in complex I and Uqcrfs1 in complex III, to match the decrease in Fe/S-cluster availability. In the absence of TTP, Uqcrfs1 levels are not decreased in iron deficiency, resulting in nonfunctional complex III, electron leakage, and oxidative damage. Mice with deletion of Ttp display cardiac dysfunction with iron deficiency, demonstrating that TTP is necessary for maintaining cardiac function in the setting of low cellular iron. Altogether, our results describe a pathway that is activated in iron deficiency to regulate mitochondrial function to match the availability of Fe/S clusters.

Keywords: cardiomyopathy; iron; mRNA-binding protein; mitochondrial complex; reactive oxygen species.


Conflict of interest statement

The authors declare no conflict of interest.

Figures

Fig. 1.
Fig. 1.
TTP regulates the expression of mitochondrial proteins in response to iron deficiency. (A and B) TTP protein (A) and cellular nonheme iron (B) levels in WT and Ttp KO MEFs in response to 24-h treatment with 80 μM BPD. (CI) Changes in mRNA levels of TCA cycle (C), complex I (D), complex II (E), complex III (F), complex IV (G), complex V (H), and assembly factor (I) proteins with AREs in their 3′ UTR in WT and Ttp KO MEFs in response to BPD. mRNAs that display a decrease with iron deficiency in WT MEFs but not in Ttp KO MEFs are circled. n = 3 for A and 6 for BI. All graphs show mean ± SEM. *P < 0.05 by ANOVA with Tukey post hoc analysis. Veh, vehicle.
Fig. 2.
Fig. 2.
Aco2, Ndufs1, and Uqcrfs1 mRNA decay and protein levels are regulated by TTP. (A) mRNA stability of Ndufs1, Ndufaf4, Uqcrfs1, and Aco2 in WT and Ttp KO MEFs treated with 7.5 μM actinomycin D. Samples were normalized to their respective RNA levels at time 0. n = 6 per time point. *P < 0.05 by unpaired Student’s t test. (BG) Representative Western blot (B) and densitometry (CG) of various proteins in H9c2 cells with indicated treatment. n = 4 per group, with B showing two representative samples. *P < 0.05 by with ANOVA with Tukey post hoc analysis. All graphs show mean ± SEM. NS, not significant.
Fig. 3.
Fig. 3.
Iron deficiency in mice increases TTP protein level and decreases NDUFS1, UQCRFS1, and ACO2 protein levels. (AC) Nonheme iron in whole cell (A), cytoplasm (B), and mitochondria (C) of Tnfr1/2−/− and Tnfr1/2−/−/Ttp−/− hearts with iron deficiency. (D) Western blot confirming the purity of mitochondrial isolation. (EH) Western blot (E) and densitometry (FH) of various proteins in hearts from Tnfr1/2−/− and Tnfr1/2−/−/Ttp−/− mice receiving regular diet (RD) and iron-deficient diet (ID). All graphs show mean ± SEM. *P < 0.05 by ANOVA with Tukey post hoc analysis. C, cytoplasm; M, mitochondria; W, whole cell. NS, not significant.
Fig. 4.
Fig. 4.
TTP binds to mRNAs of Ndufs1, Uqcrfs1, and Aco2 and regulates their levels independent of the HIF and IRP pathways. (A) Levels of Ndufs1, Uqcrfs1, and Aco2 mRNA pulled down with indicated antibody. Tfrc and Hypoxanthine Phosphoribosyltransferase 1 (Hprt1) mRNAs were used as positive and negative controls, respectively. n = 3. (B) Irp1 mRNA levels in Irp2 KO MEFs with KD of Irp1. n = 6. (C and D) Western blot (C) and densitometry (D) of TTP, NDUFS1, UQCRFS1, and ACO2 in Irp1 KD/Irp2 KO MEFs in response to BPD. n = 3. (E) Steady-state mRNA levels of Ttp, Ndufs1, Uqcrfs1, and Aco2 in Arnt KO MEFs with indicated treatment. n = 3. (FH) mRNA levels of yeast homologs of Uqcrfs1 (RIP1, F), Ndufs1 (NDI1, G), and Aco2 (ACO1, H) in cth1Δcth2Δ yeast strain expressing CTH2 (yeast TTP homolog), WT, or mutant hTTP. All graphs show mean ± SEM. *P < 0.05 by ANOVA with Tukey post hoc analysis. NS, not significant.
Fig. 5.
Fig. 5.
Deletion of Ttp results in the formation of apo-complex III. (A) BN gel of mitochondrial lysate from the hearts of Tnfr1/2−/− and Tnfr1/2−/−/Ttp−/− mice treated with regular diet (RD) and iron-deficient diet (ID). (B) Densitometry of complex III from the native gel in A normalized to complex V (CV) in the same gel. (C) Native gel immunoblotted for UQCRFS1 and UQCRC1 (another component of complex III that does not bind Fe/S clusters). (D and E) Densitometry of UQCRFS1 in C normalized to CV (D) and UQCRFS1 in C normalized to UQCRC1 (E) in the same blot. (F) Densitometry of complex I from the native gel in A normalized to complex V in the same gel. (G) Native gel of digitonin-extracted mitochondria immunoblotted for NDUFS1 and ATP synthase C (a component of CV) and complex I portion of the same membrane stained with Coomassie G-250. (H and I) Densitometry of NDUFS1 level normalized to ATP synthase C level (H) and NDUFS1 level normalized to complex I level (I). (J and K) Relative 55Fe content in pulled-down UQCRFS1 from HEK293 cells treated with vehicle (J) or BPD (K) after down-regulation of Ttp. A parallel IgG pulldown from the same lysate was used for determining nonspecific binding, and the radioactivity was normalized to UQCRFS1 levels from the same sample as determined by Western blotting. (L and M) Relative complex III activity in hearts of Tnfr1/2−/− and Tnfr1/2−/−/Ttp−/− mice treated with indicated diet (L) and in H9c2 cells treated with control or Ttp siRNA and with iron chelation for 24 h (M). Complex III activity was normalized to citrate synthase activity from the same sample. (N) Mitochondrial ROS levels in H9c2 cells treated with control or Ttp siRNA and with iron chelation. (O) Bar graph summary of N. n = 8 for B and DF, 3–4 for H and I, 4 for J and K, and 4–6 for LO. All graphs show mean ± SEM. *P < 0.05 by ANOVA with Tukey post hoc analysis. Veh, vehicle. NS, not significant.
Fig. 6.
Fig. 6.
Mitochondrial complex I and II contribute to ROS production with Ttp deletion and iron deficiency. (AC) ROS production by mitochondrial complex I (A), complex II (B), and complex III (C) in isolated mitochondria from H9c2 cells with indicated treatment. (D and E) Relative mitochondrial aconitase activity in H9c2 cells with indicated treatment (D) and in hearts of Tnfr1/2−/− and Tnfr1/2−/−/Ttp−/− mice treated with indicated diet (E). (F) Iron deficiency and TTP deletion is associated with increased cell death in neonatal rat cardiomyocytes (NRCMs). (G) H9c2 cells with double KD of Uqcrfs1 and Ttp; siRNA was titrated such that Uqcrfs1 and Ttp double-KD cells and control siRNA-treated cells have comparable UQCRFS1 levels under iron deficiency. (H and I) Representative images (H) and summary bar graph (I) of MitoSOX Red fluorescence signals in H9c2 cells treated with indicated siRNA. (Scale bars, 100 μm.) Upper right shows positive red fluorescence signal in black and white scale and lower right shows nuclear staining by Hoechst in black-and-white scale. n = 3 for AC, G, and H, 7 for D, and 4–6 for E. All graphs show mean ± SEM. *P < 0.05 by ANOVA with Tukey post hoc analysis. Veh, vehicle.
Fig. 7.
Fig. 7.
Tnfr1/2−/−/Ttp−/− mice display decreased cardiac function in iron deficiency. (A) Two-dimensional cardiac images of Tnfr1/2−/−, Tnfr1/2−/−/Ttp+/−, and Tnfr1/2−/−/Ttp−/− mice treated with regular diet (RD) and iron-deficient diet (ID). (BD) LVEF (B), LVFS (C), and LV wall thickness (D) as assessed by echocardiography in Tnfr1/2−/−, Tnfr1/2−/−/Ttp+/−, and Tnfr1/2−/−/Ttp−/− mice treated with indicated diet. (E and F) HW-to-BW ratio (E) and HW-to-TL ratio (F) in Tnfr1/2−/− and Tnfr1/2−/−/Ttp−/− mice in the presence and absence of iron deficiency. (G) Correlation between Hgb and LVEF in Tnfr1/2−/− and Tnfr1/2−/−/Ttp−/− mice treated with ID. (H) Masson’s trichrome and H&E staining of hearts from Tnfr1/2−/− and Tnfr1/2−/−/Ttp−/− mice after RD or ID, demonstrating lack of fibrosis. (Scale bars: black scale, 1 mm and white scale, 50 μm.) (I) Oxidative stress, as assessed by lipid peroxidation, in the hearts of Tnfr1/2−/− and Tnfr1/2−/−/Ttp−/− mice treated with RD or ID. n = 6–12 for BF and 3 for I. All graphs show mean ± SEM. *P < 0.05 and #P < 0.1 by ANOVA with Tukey post hoc analysis.

References

    1. McLean E, Cogswell M, Egli I, Wojdyla D, de Benoist B. Worldwide prevalence of anaemia, WHO Vitamin and Mineral Nutrition Information System, 1993-2005. Public Health Nutr. 2009;12:444–454. - PubMed
    1. Pantopoulos K. Iron metabolism and the IRE/IRP regulatory system: An update. Ann N Y Acad Sci. 2004;1012:1–13. - PubMed
    1. Rouault TA. The role of iron regulatory proteins in mammalian iron homeostasis and disease. Nat Chem Biol. 2006;2:406–414. - PubMed
    1. Abboud S, Haile DJ. A novel mammalian iron-regulated protein involved in intracellular iron metabolism. J Biol Chem. 2000;275:19906–19912. - PubMed
    1. Eisenstein RS. Iron regulatory proteins and the molecular control of mammalian iron metabolism. Annu Rev Nutr. 2000;20:627–662. - PubMed

Publication types