. 2018 Jul 3;115(27):6940-6945.
doi: 10.1073/pnas.1801678115. Epub 2018 Jun 18.

Three-dimensional virtual histology of human cerebellum by X-ray phase-contrast tomography

Affiliations

Three-dimensional virtual histology of human cerebellum by X-ray phase-contrast tomography

Mareike Töpperwien et al. Proc Natl Acad Sci U S A. .

Abstract

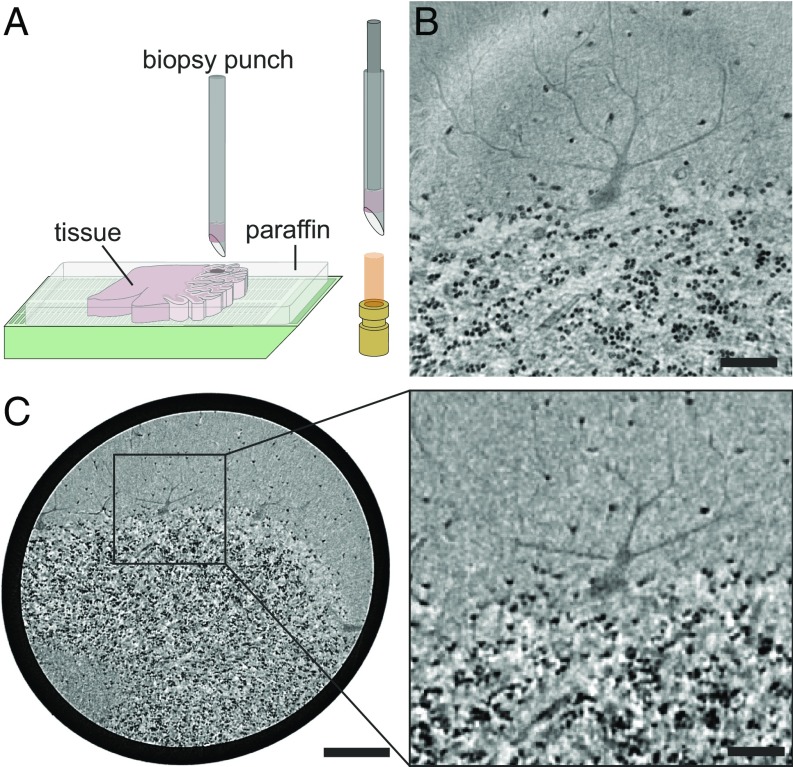
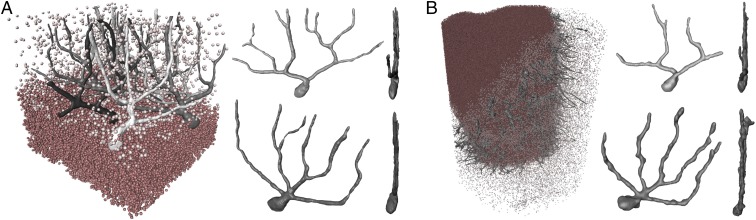
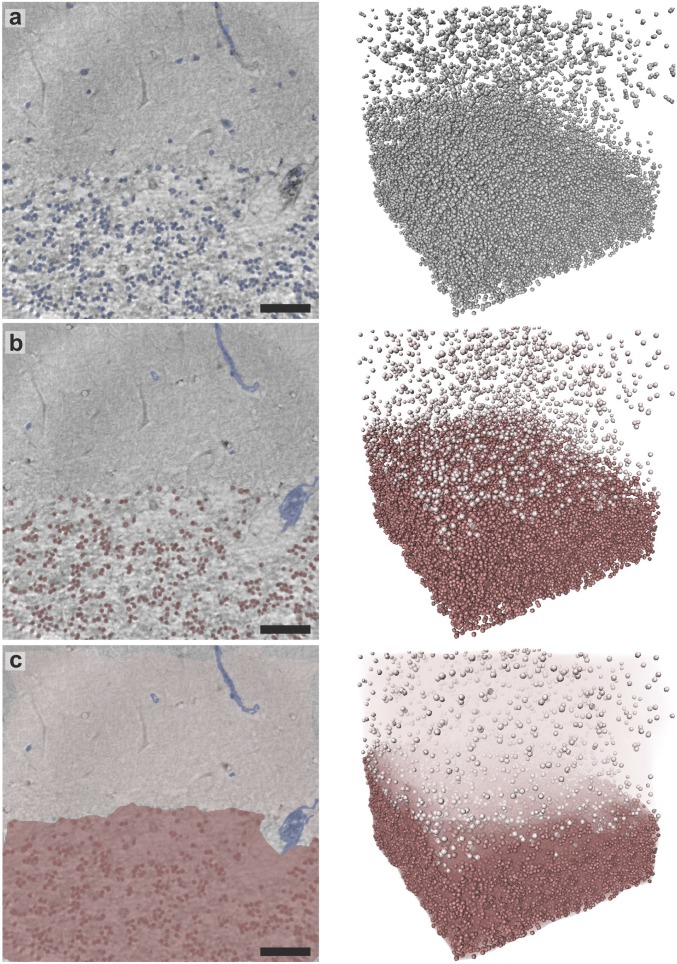
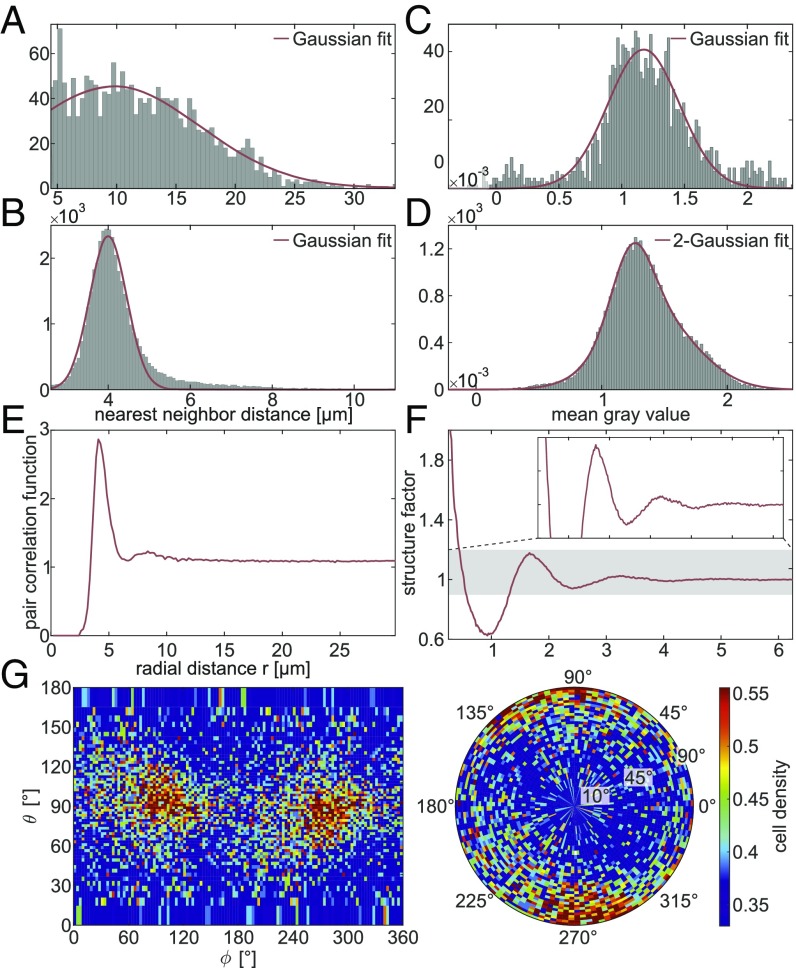
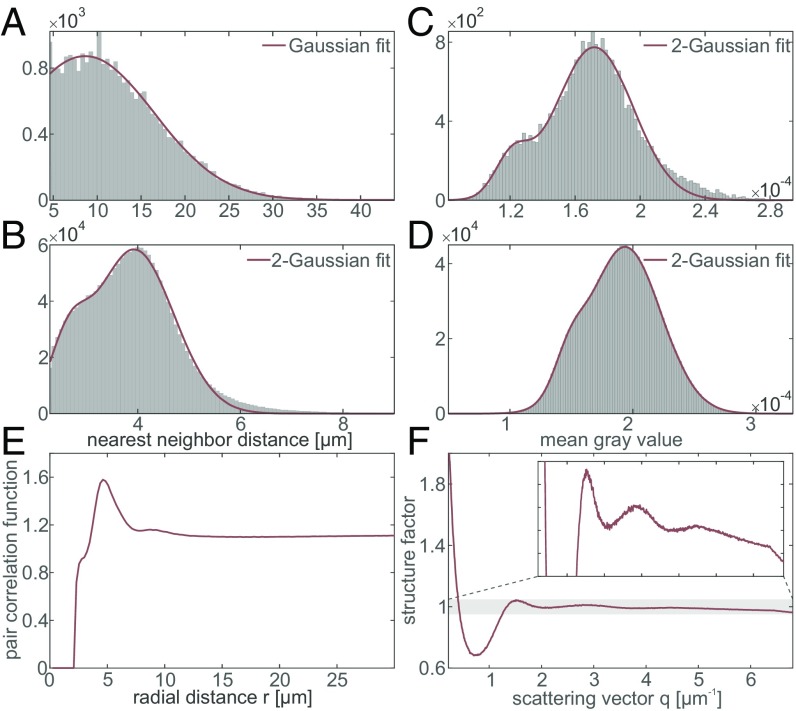
To quantitatively evaluate brain tissue and its corresponding function, knowledge of the 3D cellular distribution is essential. The gold standard to obtain this information is histology, a destructive and labor-intensive technique where the specimen is sliced and examined under a light microscope, providing 3D information at nonisotropic resolution. To overcome the limitations of conventional histology, we use phase-contrast X-ray tomography with optimized optics, reconstruction, and image analysis, both at a dedicated synchrotron radiation endstation, which we have equipped with X-ray waveguide optics for coherence and wavefront filtering, and at a compact laboratory source. As a proof-of-concept demonstration we probe the 3D cytoarchitecture in millimeter-sized punches of unstained human cerebellum embedded in paraffin and show that isotropic subcellular resolution can be reached at both setups throughout the specimen. To enable a quantitative analysis of the reconstructed data, we demonstrate automatic cell segmentation and localization of over 1 million neurons within the cerebellar cortex. This allows for the analysis of the spatial organization and correlation of cells in all dimensions by borrowing concepts from condensed-matter physics, indicating a strong short-range order and local clustering of the cells in the granular layer. By quantification of 3D neuronal "packing," we can hence shed light on how the human cerebellum accommodates 80% of the total neurons in the brain in only 10% of its volume. In addition, we show that the distribution of neighboring neurons in the granular layer is anisotropic with respect to the Purkinje cell dendrites.

Keywords: 3D virtual histology; X-ray phase-contrast tomography; automatic cell counting; human brain cytoarchitecture.


Conflict of interest statement

The authors declare no conflict of interest.

Figures

Fig. 1.
Fig. 1.
Virtual histology of human cerebellum. (A) Sample preparation for tomographic experiments. Biopsy punches were taken from paraffin-embedded human cerebellum and placed into a Kapton tube for mounting in the experimental setups. (B) Transverse slice through the reconstructed volume of the synchrotron dataset revealing the interface between the low-cell molecular and the cell-rich granular layer, including a cell of the monocellular Purkinje cell layer. (C, Left) Corresponding slice of the laboratory dataset (same plane, same specimen as in B), showing the larger volume accessible by the laboratory setup while maintaining the resolution required for single-cell identification. (C, Right) Magnified view of the region marked by the rectangle in C, Left corresponding to the field of view of the synchrotron dataset in B. [Scale bars: 50 μm (B and C, Right) and 200 μm (C, Left).]
Fig. 2.
Fig. 2.
Volume representation of the data. (A) Cellular segmentation of the cells in the granular layer (dark red), the molecular layer (light red), and the Purkinje cell layer (shades of gray) with two exemplary Purkinje cells shown separately (Right), from front and side views. (B) The same segmentation for the laboratory dataset. Note that the individual Purkinje cells are the same as for the synchrotron dataset and that the thick branches of the dendritic tree can already be resolved with the laboratory setup.
Fig. 3.
Fig. 3.
Results of the automated segmentation procedure, shown in an exemplary 2D slice through the reconstruction volume as well as in a 3D view. (A) Overlay of all cell nuclei detected by the algorithm (blue). (B) Result after manual removal of blood vessels (blue) and separation into ML (light red) and GL (dark red), based on the mean distance to the 35 nearest neighbors of each cell. (C) Volume estimation for each layer used for determination of the cell densities in the two regions. (Scale bars: 50 μm.)
Fig. 4.
Fig. 4.
Statistical measures obtained from the automatically determined cell positions. (A) Histogram showing the nearest-neighbor distances in the ML. The Gaussian fit reveals a mean nearest-neighbor distance of 9.7±0.8 μm (95% confidence interval) with SD σ=7.3±0.8 μm. (B) Histogram of the nearest-neighbor distances in the GL, with a Gaussian fit indicating a mean of 4.00±0.02 μm with SD σ=0.45±0.02 μm. (C) Histogram showing the mean gray value within the automatically detected cell volume in the ML. A Gaussian fit leads to (1.17±0.02)103 with SD (σ=2.9±0.2)104. (D) Histogram of the mean gray value in the GL. The shape is best fitted by a 2-Gaussian function with peak values of (1.24±0.01)103 and (1.6±0.1)103 and SDs σ1=(1.6±0.1)104 and σ2=(3.4±0.1)104 in an approximate ratio of 30:70. (E) Angular averaged pair correlation function of the cells in the GL revealing two distinct peaks at 4.16±0.04 μm and 8.5±0.3 μm. (F) Angular averaged structure factor of the cells in the GL. (G) Angular distribution of nearest neighbors in the GL, where θ90 corresponds to the plane in which the dendritic tree of the Purkinje cells is spreading and ϕ=90 is approximately parallel to the interface between the ML and GL (SI Appendix, SI Methods).
Fig. 5.
Fig. 5.
Statistical measures obtained from the laboratory dataset. (A) Histogram of the nearest-neighbor distances in the ML. The Gaussian fit reveals a mean nearest-neighbor distance of 8.6±0.4 μm (95% confidence interval) with SD σ=7.8±0.4 μm. (B) The same histogram for the cells detected in the GL. A 2-Gaussian function with peaks at 3.93±0.02 μm and 2.64±0.02 μm with SDs σ1=0.77±0.03 μm and σ2=0.35±0.04 μm (approximate aspect ratio 86:14) fitted the data best. (C) Histogram of the mean gray value within the volume of a single cell. The 2-Gaussian fit leads to peaks at (1.72±0.01)104 and (1.21±0.02)104 with SDs σ1=(2.4±0.1)105 and σ2=(1.1±0.2)105 and an approximate weight ratio of 90:10. (D) Histogram of the mean gray values within the detected cells of the GL. The 2-Gaussian fit reveals peaks at 1.936±0.001104 and 1.483±0.001104 with SDs σ1=(2.92±0.01)105 and σ2=(1.23±0.02)105 (approximate aspect ratio 90:10). (E) Pair correlation function of the cells in the GL with the two principle peaks at 4.74±0.04 μm and 8.7±0.1 μm and also a minor modulation at 2.50±0.05 μm. (F) Structure factor of the GL.

References

    1. Paganin D, Nugent KA. Noninterferometric phase imaging with partially coherent light. Phys Rev Lett. 1998;80:2586–2589.
    1. Cloetens P, et al. Holotomography: Quantitative phase tomography with micrometer resolution using hard synchrotron radiation x rays. Appl Phys Lett. 1999;75:2912–2914.
    1. Zhu P, et al. Low-dose, simple, and fast grating-based X-ray phase-contrast imaging. Proc Natl Acad Sci USA. 2010;107:13576–13581. - PMC - PubMed
    1. Zanette I, et al. Trimodal low-dose X-ray tomography. Proc Natl Acad Sci USA. 2012;109:10199–10204. - PMC - PubMed
    1. Munro PR, Ignatyev K, Speller RD, Olivo A. Phase and absorption retrieval using incoherent X-ray sources. Proc Natl Acad Sci USA. 2012;109:13922–13927. - PMC - PubMed

Publication types