. 2018 Jul 3;115(27):7129-7134.
doi: 10.1073/pnas.1719033115. Epub 2018 Jun 18.

Serine metabolism in the brain regulates starvation-induced sleep suppression in Drosophila melanogaster

Affiliations

Serine metabolism in the brain regulates starvation-induced sleep suppression in Drosophila melanogaster

Jun Young Sonn et al. Proc Natl Acad Sci U S A. .

Abstract

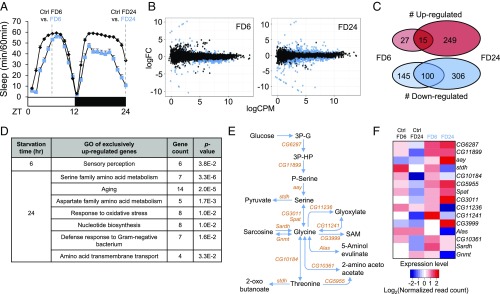
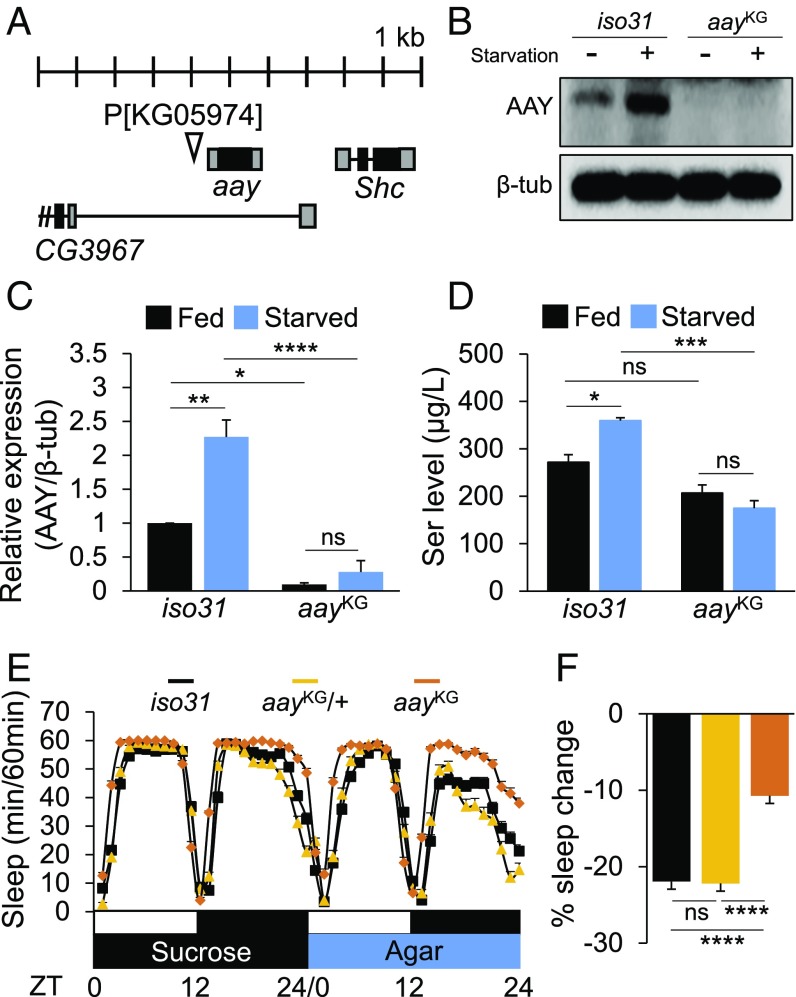
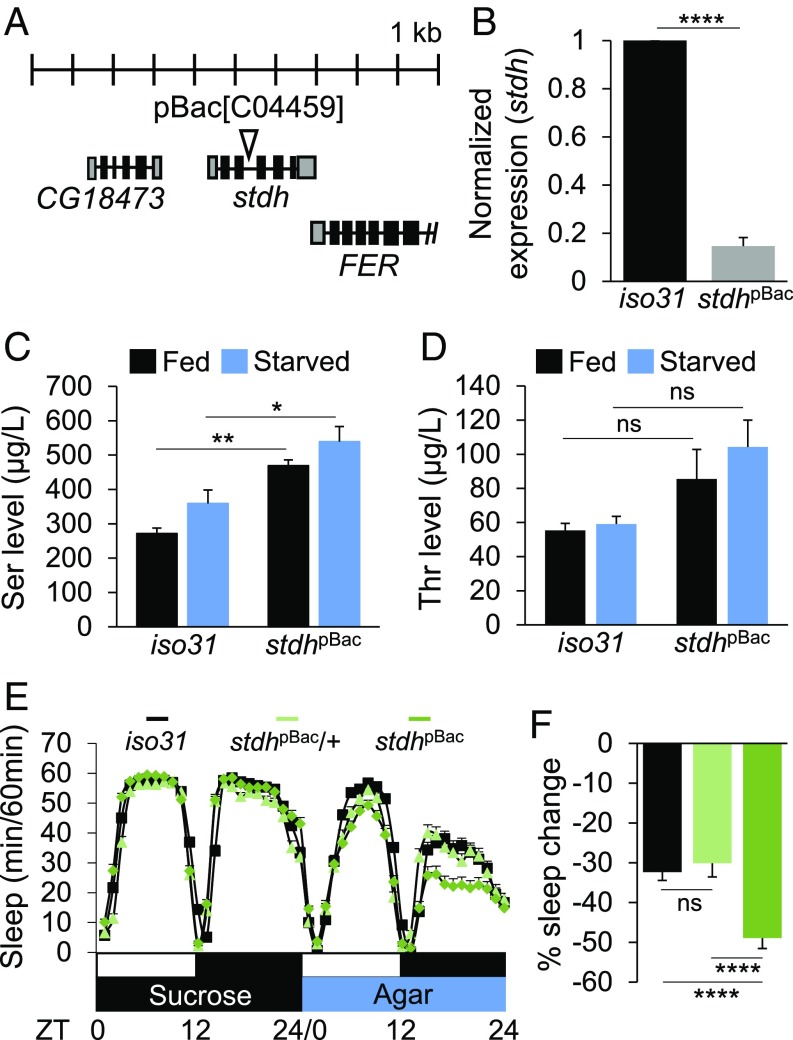
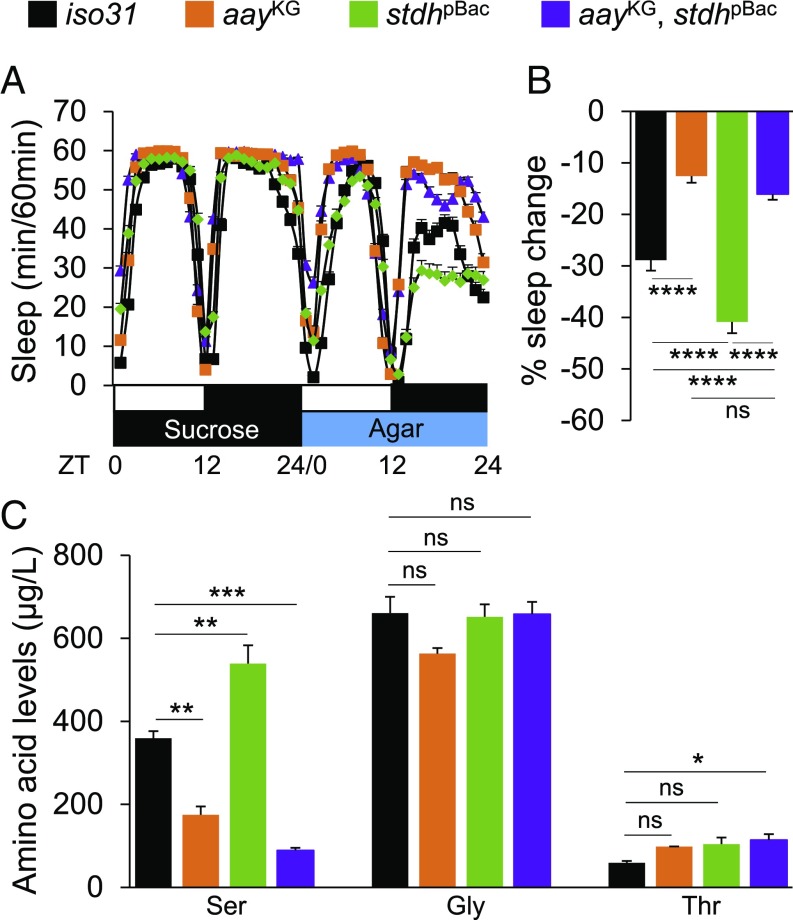
Sleep and metabolism are physiologically and behaviorally intertwined; however, the molecular basis for their interaction remains poorly understood. Here, we identified a serine metabolic pathway as a key mediator for starvation-induced sleep suppression. Transcriptome analyses revealed that enzymes involved in serine biosynthesis were induced upon starvation in Drosophila melanogaster brains. Genetic mutants of astray (aay), a fly homolog of the rate-limiting phosphoserine phosphatase in serine biosynthesis, displayed reduced starvation-induced sleep suppression. In contrast, a hypomorphic mutation in a serine/threonine-metabolizing enzyme, serine/threonine dehydratase (stdh), exaggerated starvation-induced sleep suppression. Analyses of double mutants indicated that aay and stdh act on the same genetic pathway to titrate serine levels in the head as well as to adjust starvation-induced sleep behaviors. RNA interference-mediated depletion of aay expression in neurons, using cholinergic Gal4 drivers, phenocopied aay mutants, while a nicotinic acetylcholine receptor antagonist selectively rescued the exaggerated starvation-induced sleep suppression in stdh mutants. Taken together, these data demonstrate that neural serine metabolism controls sleep during starvation, possibly via cholinergic signaling. We propose that animals have evolved a sleep-regulatory mechanism that reprograms amino acid metabolism for adaptive sleep behaviors in response to metabolic needs.

Keywords: serine; sleep regulation; starvation.


Conflict of interest statement

The authors declare no conflict of interest.

Figures

Fig. 1.
Fig. 1.
Transcriptome analyses of starved Drosophila brains identify up-regulation of serine biosynthesis pathway. (A) Schematic diagram depicting RNA-seq experimental design. Wild-type flies were fed 5% sucrose/1% agar (Ctrl) or deprived of sucrose for 6 and 24 h (FD6 and FD24). (B) Scatter plots demonstrate log counts per million (cpm) vs. log fold-change (FC) in expression of brains starved for 6 and 24 h. Blue dots represent DEGs (FDR < 0.05). (C) Venn diagram showing the number of genes that are regulated during short-term (FD6) and long-term (FD24) starvation. (D) Gene ontology analysis of genes that are up-regulated exclusively in FD6 and FD24. (E) Schematic diagram of the serine metabolic pathway. (F) Heat-map of expression level of genes involved in the serine metabolic pathway in fed (Ctrl FD6 and Ctrl FD24) and starved conditions (FD6 and FD24). Colors indicate the log2 values of normalized read counts.
Fig. 2.
Fig. 2.
Starvation-induced aay expression elevates free serine levels in heads and supports sleep suppression during starvation. (A) Schematic diagram illustrating KG05974 insertion near the 5′UTR of aay locus. (B) Western blot of head extracts in iso31 and aayKG flies during fed and starved conditions. (C) Quantification of Western blots (n = 3) [F(1,8) = 12.92; P = 0.0070]. (D) Serine concentrations in head extracts of iso31 control and aayKG flies during fed and starved conditions (n = 3) [F(1,8) = 14.53; P = 0.0052]. (E) Average sleep traces of iso31 control (black; n = 88), aayKG/+ (light orange; n = 80), and aayKG (orange; n = 78) flies. (F) Percentage sleep change during starvation in iso31 and aayKG/+ controls vs. aayKG flies. ns, P > 0.05; *P < 0.05; **P < 0.005; ***P < 0.0005; ****P < 0.0001. All error bars represent SEM.
Fig. 3.
Fig. 3.
stdh metabolizes free serine and limits starvation-induced sleep suppression. (A) Schematic diagram illustrating C04459 insertion in the intron of the stdh locus. (B) stdh transcript levels are strongly repressed in stdhpBac flies (n = 3). (C) Serine and (D) threonine concentrations in head extracts of iso31 control and stdhpBac flies during fed and starved conditions (n = 3). (E) Average sleep traces of iso31 (black; n = 91), stdhpBac/+ (light green; n = 81), and stdhpBac flies (green; n = 83). (F) Percentage sleep change during starvation in iso31 and stdhpBac/+ controls vs. stdhpBac flies. ns, P > 0.05; *P < 0.05; **P < 0.005; ****P < 0.0001. All error bars represent SEM.
Fig. 4.
Fig. 4.
aay and stdh act in the same genetic pathway to titrate free serine levels and control sleep during starvation. (A) Average sleep traces of iso31 (black; n = 116), aayKG (orange; n = 81), stdhpBac (green; n = 104), and double mutants (purple; n = 160). (B) aayKG masks the exaggerated starvation-induced sleep suppression of stdhpBac flies [F(1,457) = 6.035; P = 0.0144]. (C) Comparison of serine, glycine, and threonine levels in head extracts of iso31 and mutants in starved condition (n = 3). ns, P > 0.05; *P < 0.05; **P < 0.005; ***P < 0.0005; ****P < 0.0001. All error bars represent SEM.
Fig. 5.
Fig. 5.
Sleep regulation by the serine metabolic pathway implicates cholinergic signaling. (A) Percentage sleep change during starvation in flies with pan-neuronal and glial knockdown of aay transcripts (aay RNAi #1/+, n = 37; elav-Gal4/+, n = 46; elav-Gal4 > aay RNAi #1, n = 42; nrv2-Gal4/+, n = 29; nrv2-Gal4 > aay RNAi #1, n = 21). (B) Percentage sleep change during starvation when aay transcripts are depleted in mushroom body (MB), fan-shaped body (FB), pars intercerebralis (PI), leucokinin, clock, and various neurotransmitter-related regions in the brain (n = 7–33). (C) Dose-dependent effect of MCA administration on stdhpBac flies during starvation. The 200 μM MCA effect: [F(1,281) = 3.637; P = 0.0575] and 800 μM MCA effect: [F(1,284) = 6.071; P = 0.0143]. iso31 0 μM, n = 71; iso31 200 μM, n = 79; iso31 800 μM, n = 81; stdhpBac 0 μM, n = 66; stdhpBac 200 μM, n = 69; and stdhpBac 800 μM, n = 70. ns, P > 0.05; *P < 0.05; **P < 0.005; ***P < 0.0005; ****P < 0.0001. All error bars represent SEM.

References

    1. Hinard V, et al. Key electrophysiological, molecular, and metabolic signatures of sleep and wakefulness revealed in primary cortical cultures. J Neurosci. 2012;32:12506–12517. - PMC - PubMed
    1. Davies SK, et al. Effect of sleep deprivation on the human metabolome. Proc Natl Acad Sci USA. 2014;111:10761–10766. - PMC - PubMed
    1. Weljie AM, et al. Oxalic acid and diacylglycerol 36:3 are cross-species markers of sleep debt. Proc Natl Acad Sci USA. 2015;112:2569–2574. - PMC - PubMed
    1. Spiegel K, Tasali E, Penev P, Van Cauter E. Brief communication: Sleep curtailment in healthy young men is associated with decreased leptin levels, elevated ghrelin levels, and increased hunger and appetite. Ann Intern Med. 2004;141:846–850. - PubMed
    1. Nedeltcheva AV, et al. Sleep curtailment is accompanied by increased intake of calories from snacks. Am J Clin Nutr. 2009;89:126–133. - PMC - PubMed

Publication types

LinkOut - more resources