

Proteomic Architecture of Human Coronary and Aortic Atherosclerosis
- PMID: 29915101
- PMCID: PMC6011234
- DOI: 10.1161/CIRCULATIONAHA.118.034365
Proteomic Architecture of Human Coronary and Aortic Atherosclerosis
Abstract
Backgound: The inability to detect premature atherosclerosis significantly hinders implementation of personalized therapy to prevent coronary heart disease. A comprehensive understanding of arterial protein networks and how they change in early atherosclerosis could identify new biomarkers for disease detection and improved therapeutic targets.
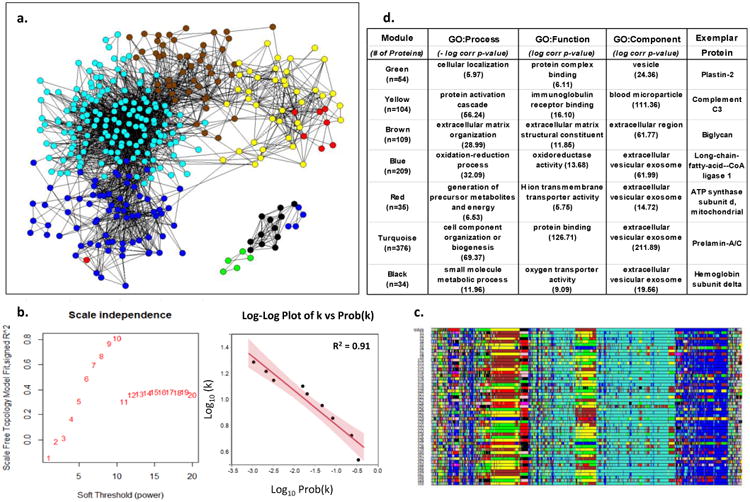
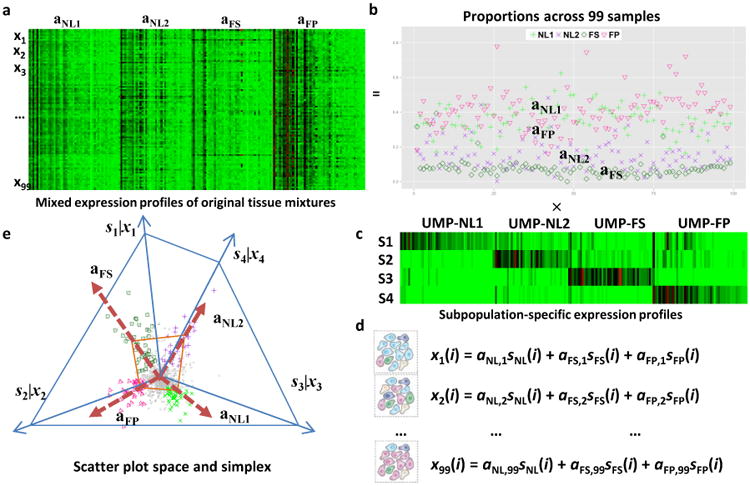
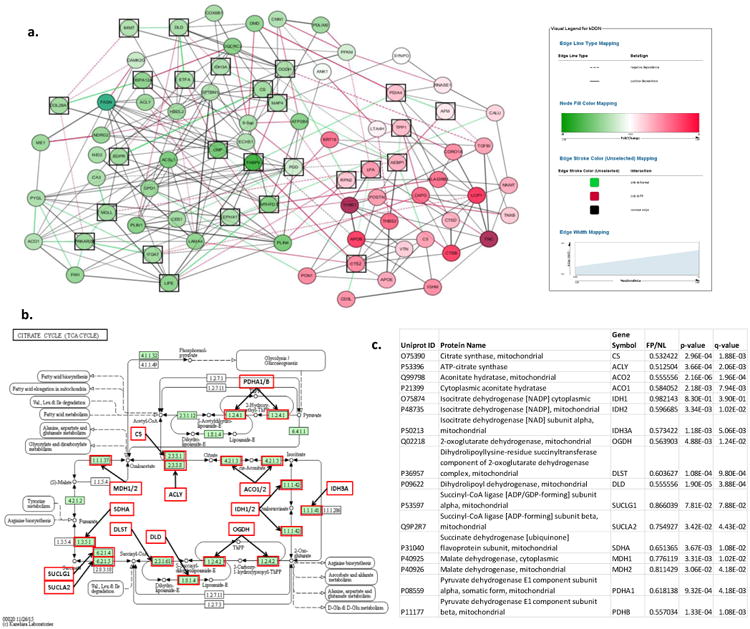
Methods: Here we describe the human arterial proteome and proteomic features strongly associated with early atherosclerosis based on mass spectrometry analysis of coronary artery and aortic specimens from 100 autopsied young adults (200 arterial specimens). Convex analysis of mixtures, differential dependent network modeling, and bioinformatic analyses defined the composition, network rewiring, and likely regulatory features of the protein networks associated with early atherosclerosis and how they vary across 2 anatomic distributions.
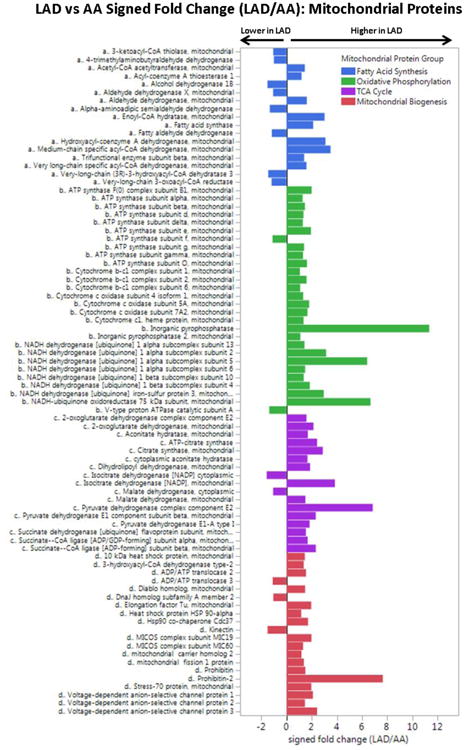
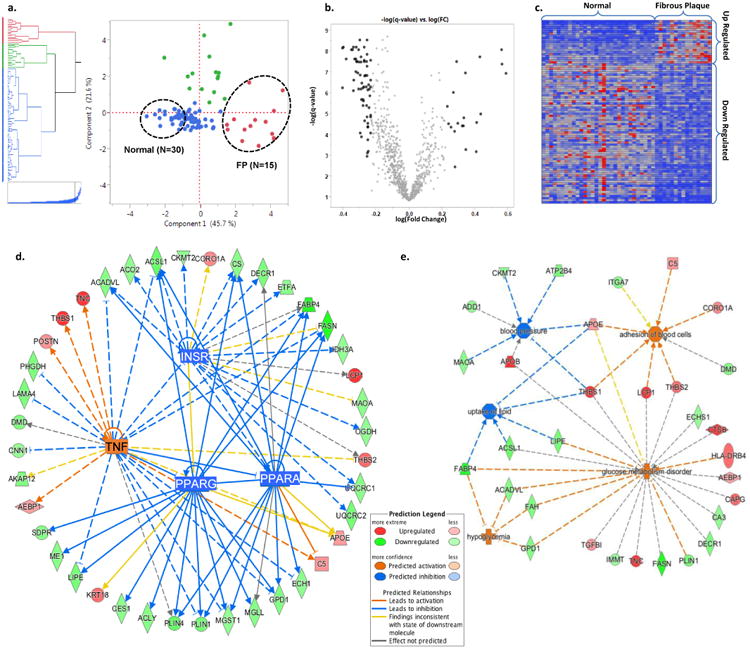
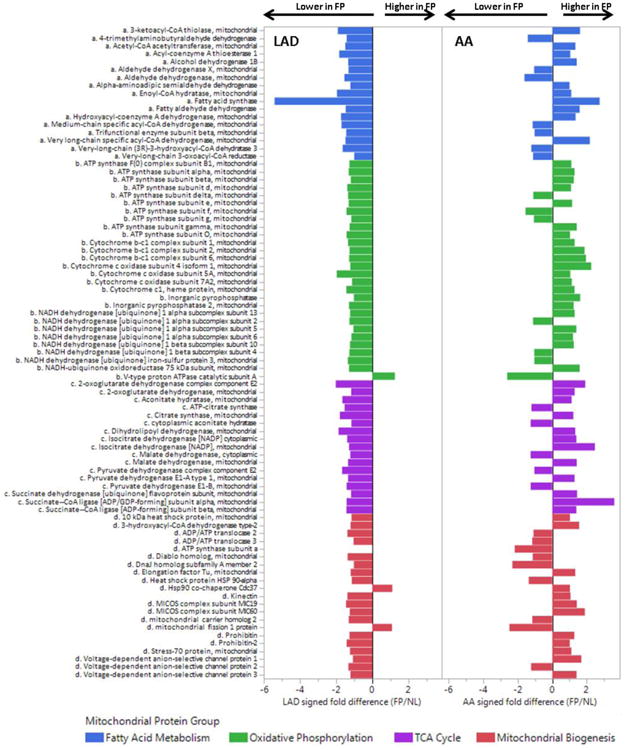
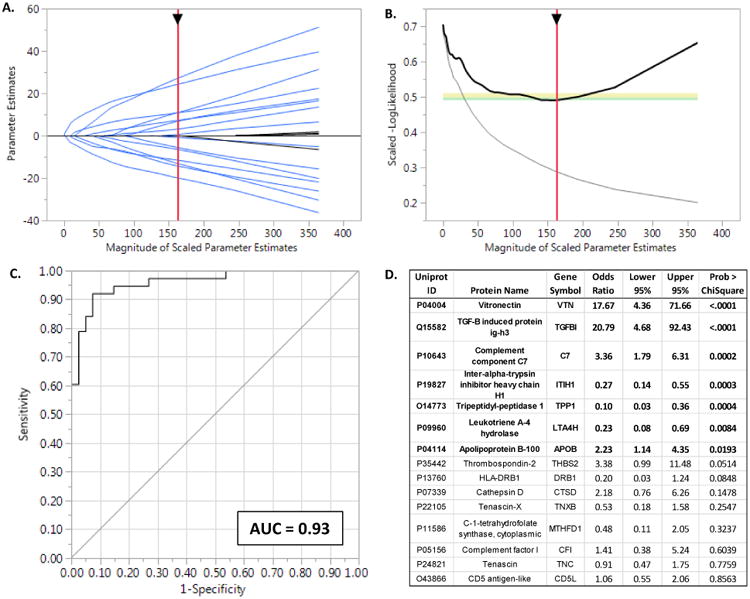
Results: The data document significant differences in mitochondrial protein abundance between coronary and aortic samples (coronary>>aortic), and between atherosclerotic and normal tissues (atherosclerotic<<normal), and major alterations in tumor necrosis factor, insulin receptor, peroxisome proliferator-activated receptor-α, and peroxisome proliferator-activated receptor-γ protein networks, as well, in the setting of early disease. In addition, a subset of tissue protein biomarkers indicative of early atherosclerosis was shown to predict anatomically defined coronary atherosclerosis when measured in plasma samples in a separate clinical cohort (area under the curve=0.92 [0.83-0.96]), thereby validating the use of human tissue proteomics to discover relevant plasma biomarkers for clinical applications. In addition to the specific proteins and pathways identified here, the publicly available data resource and the analysis pipeline used illustrate a strategy for interrogating and interpreting the proteomic architecture of tissues that may be relevant for other chronic diseases characterized by multicellular tissue phenotypes.
Conclusions: The human arterial proteome can be viewed as a complex network whose architectural features vary considerably as a function of anatomic location and the presence or absence of atherosclerosis. The data suggest important reductions in mitochondrial protein abundance in early atherosclerosis and also identify a subset of plasma proteins that are highly predictive of angiographically defined coronary disease.
Keywords: atherosclerosis; biomarkers; mitochondria; proteomics.
© 2018 American Heart Association, Inc.
Figures
Similar articles
-
Proteomic landscape of human coronary artery atherosclerosis.Int J Mol Med. 2020 Jul;46(1):371-383. doi: 10.3892/ijmm.2020.4600. Epub 2020 May 12. Int J Mol Med. 2020. PMID: 32626919 Free PMC article.
-
Adiponectin/T-cadherin and apelin/APJ expression in human arteries and periadventitial fat: implication of local adipokine signaling in atherosclerosis?Cardiovasc Pathol. 2014 May-Jun;23(3):131-8. doi: 10.1016/j.carpath.2014.02.003. Epub 2014 Feb 25. Cardiovasc Pathol. 2014. PMID: 24675084
-
Chemerin and CMKLR1 expression in human arteries and periadventitial fat: a possible role for local chemerin in atherosclerosis?BMC Cardiovasc Disord. 2014 Apr 30;14:56. doi: 10.1186/1471-2261-14-56. BMC Cardiovasc Disord. 2014. PMID: 24779513 Free PMC article.
-
Searching for Atherosclerosis Biomarkers by Proteomics: A Focus on Lesion Pathogenesis and Vulnerability.Int J Mol Sci. 2023 Oct 14;24(20):15175. doi: 10.3390/ijms242015175. Int J Mol Sci. 2023. PMID: 37894856 Free PMC article. Review.
-
Proteomic Studies of Blood and Vascular Wall in Atherosclerosis.Int J Mol Sci. 2021 Dec 9;22(24):13267. doi: 10.3390/ijms222413267. Int J Mol Sci. 2021. PMID: 34948066 Free PMC article. Review.
Cited by
-
Association between aortic calcification and cytokine levels in patients with peripheral artery disease.Clin Transl Sci. 2024 Oct;17(10):e70036. doi: 10.1111/cts.70036. Clin Transl Sci. 2024. PMID: 39344403 Free PMC article.
-
Downregulation of NAGLU in VEC Increases Abnormal Accumulation of Lysosomes and Represents a Predictive Biomarker in Early Atherosclerosis.Front Cell Dev Biol. 2022 Jan 26;9:797047. doi: 10.3389/fcell.2021.797047. eCollection 2021. Front Cell Dev Biol. 2022. PMID: 35155448 Free PMC article.
-
Cardiac Proteome Profiling in Ischemic and Dilated Cardiomyopathy Mouse Models.Front Physiol. 2019 Jun 18;10:750. doi: 10.3389/fphys.2019.00750. eCollection 2019. Front Physiol. 2019. PMID: 31275164 Free PMC article.
-
Pathophysiological insights into HFpEF from studies of human cardiac tissue.Nat Rev Cardiol. 2025 Feb;22(2):90-104. doi: 10.1038/s41569-024-01067-1. Epub 2024 Aug 28. Nat Rev Cardiol. 2025. PMID: 39198624 Free PMC article. Review.
-
Systems Genetics for Mechanistic Discovery in Heart Diseases.Circ Res. 2020 Jun 5;126(12):1795-1815. doi: 10.1161/CIRCRESAHA.119.315863. Epub 2020 Jun 4. Circ Res. 2020. PMID: 32496909 Free PMC article. Review.
References
-
- Hanzawa H, Sakamoto T, Kaneko A, Manri N, Zhao Y, Zhao S, Tamaki N, Kuge Y. Combined Plasma and Tissue Proteomic Study of Atherogenic Model Mouse: Approach To Elucidate Molecular Determinants in Atherosclerosis Development. J Proteome Res. 2015;14:4257–4269. - PubMed
-
- Mayr M, Chung YL, Mayr U, Yin X, Ly L, Troy H, Fredericks S, Hu Y, Griffiths JR, Xu Q. Proteomic and metabolomic analyses of atherosclerotic vessels from apolipoprotein E-deficient mice reveal alterations in inflammation, oxidative stress, and energy metabolism. Arterioscler Thromb Vasc Biol. 2005;25:2135–2142. - PubMed
-
- Fach EM, Garulacan LA, Gao J, Xiao Q, Storm SM, Dubaquie YP, Hefta SA, Opiteck GJ. In vitro biomarker discovery for atherosclerosis by proteomics. Mol Cell Proteomics. 2004;3:1200–1210. - PubMed
-
- Conway JP, Kinter M. Proteomic and transcriptomic analyses of macrophages with an increased resistance to oxidized low density lipoprotein (oxLDL)-induced cytotoxicity generated by chronic exposure to oxLDL. Mol Cell Proteomics. 2005;4:1522–1540. - PubMed
Publication types
MeSH terms
Substances
Grants and funding
LinkOut - more resources
Full Text Sources
Other Literature Sources
Medical
