

Genetic Diversity and Cooccurrence Patterns of Marine Cyanopodoviruses and Picocyanobacteria
- PMID: 29915108
- PMCID: PMC6070758
- DOI: 10.1128/AEM.00591-18
Genetic Diversity and Cooccurrence Patterns of Marine Cyanopodoviruses and Picocyanobacteria
Abstract
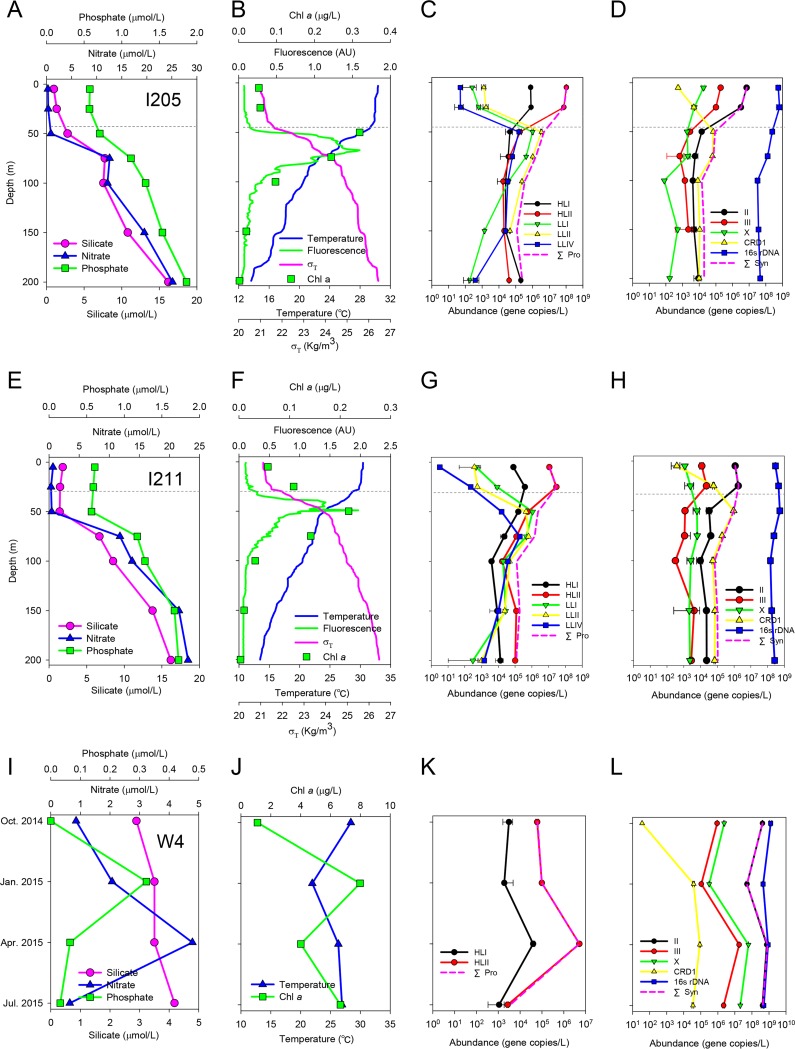
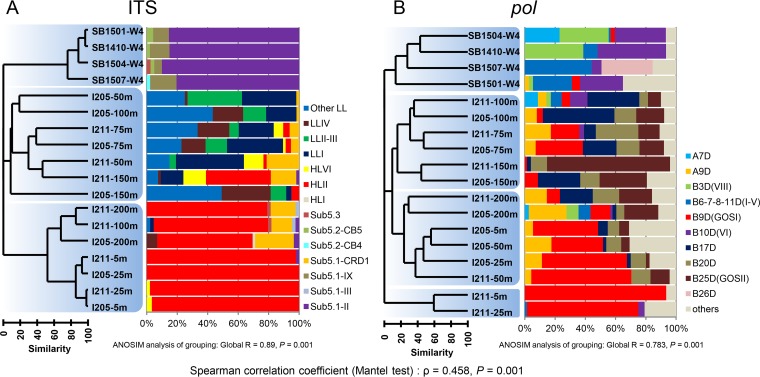
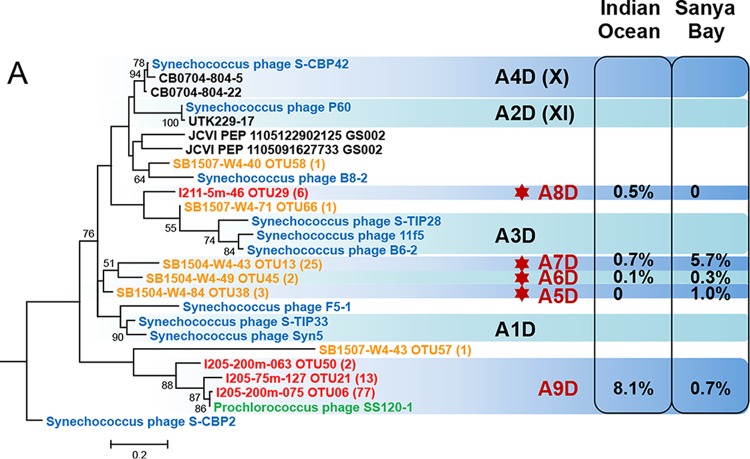
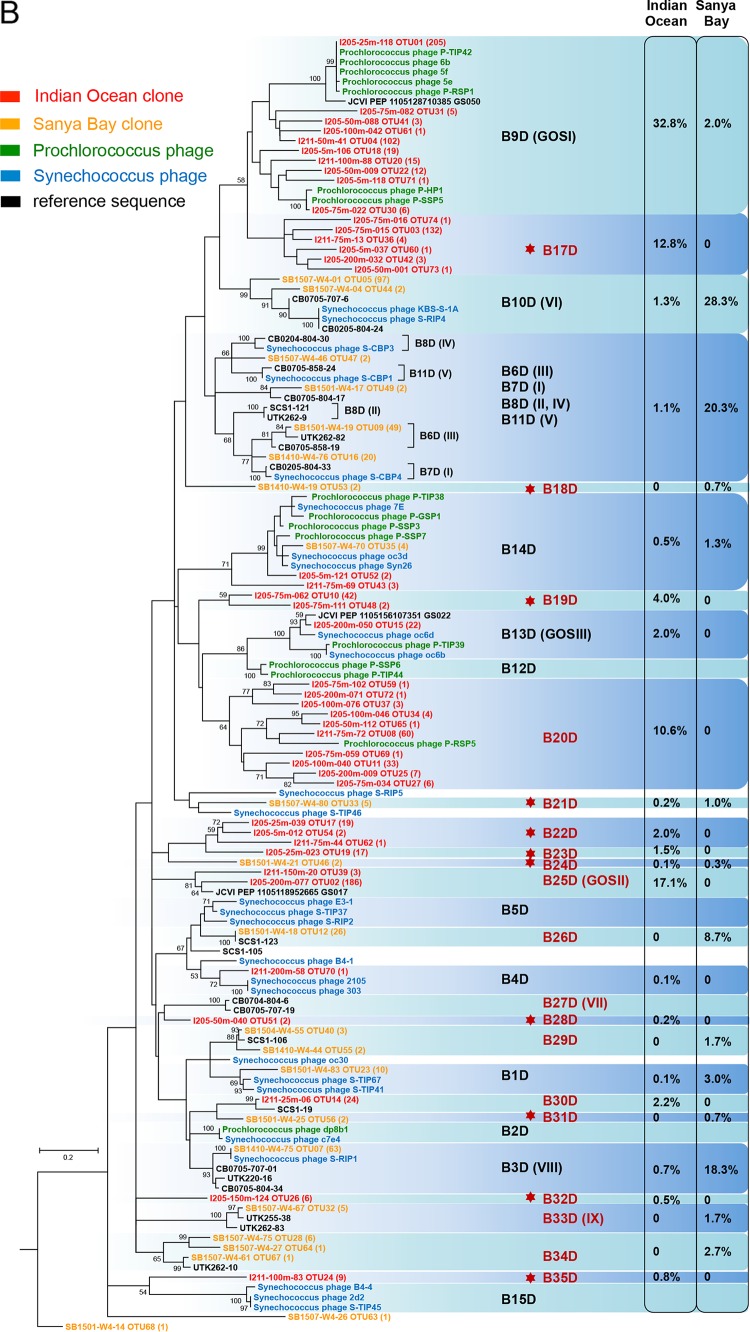
Picocyanobacteria Prochlorococcus and Synechococcus are abundant in the global oceans and subject to active viral infection. In this study, the genetic diversity of picocyanobacteria and the genetic diversity of cyanopodoviruses were synchronously investigated along water columns in the equatorial Indian Ocean and over a seasonal time course in the coastal Sanya Bay, South China Sea. Using the 16S-23S rRNA internal transcribed spacer (ITS)-based clone library and quantitative PCR (qPCR) analyses, the picocyanobacterial community composition and abundance were determined. Sanya Bay was dominated by clade II Synechococcus during all the seasons, and a typical population shift from high-light-adapted Prochlorococcus to low-light-adapted Prochlorococcus was found along the vertical profiles. Strikingly, the DNA polymerase gene sequences of cyanopodoviruses revealed a much greater genetic diversity than we expected. Nearly one-third of the phylogenetic groups were newly described here. No apparent seasonal pattern was observed for the Sanya Bay picocyanobacterial or cyanopodoviral communities. Different dominant cyanopodovirus lineages were identified for the coastal area, upper euphotic zone, and middle-to-lower euphotic zone of the open ocean. Diversity indices of both picocyanobacteria and cyanopodoviruses were highest in the middle euphotic zone and both were lower in the upper euphotic zone, reflecting a host-virus interaction. Cyanopodoviral communities differed significantly between the upper euphotic zone and the middle-to-lower euphotic zone, showing a vertical pattern similar to that of picocyanobacteria. However, in the surface waters of the open ocean, cyanopodoviruses exhibited no apparent biogeographic pattern, differing from picocyanobacteria. This study demonstrates correlated distribution patterns of picocyanobacteria and cyanopodoviruses, as well as the complex biogeography of cyanopodoviruses.IMPORTANCE Picocyanobacteria are highly diverse and abundant in the ocean and display remarkable global biogeography and a vertical distribution pattern. However, how the diversity and distribution of picocyanobacteria affect those of the viruses that infect them remains largely unknown. Here we synchronously analyzed the community structures of cyanopodoviruses and picocyanobacteria at spatial and temporal scales. Both spatial and temporal variations of cyanopodoviral communities can be linked to those of picocyanobacteria. The coastal area, upper euphotic zone, and middle-to-lower euphotic zone of the open ocean have distinct cyanopodoviral communities, showing horizontal and vertical variation patterns closely related to those of picocyanobacteria. These findings emphasize the driving force of host community in shaping the biogeographic structure of viruses. Our work provides important information for future assessments of the ecological roles of viruses and hosts for each other.
Keywords: DNA polymerase; community composition; cyanophages; cyanopodoviruses; picocyanobacteria.
Copyright © 2018 American Society for Microbiology.
Figures

Similar articles
-
Novel lineages of Prochlorococcus and Synechococcus in the global oceans.ISME J. 2012 Feb;6(2):285-97. doi: 10.1038/ismej.2011.106. Epub 2011 Sep 29. ISME J. 2012. PMID: 21955990 Free PMC article.
-
Marine cyanophages demonstrate biogeographic patterns throughout the global ocean.Appl Environ Microbiol. 2015 Jan;81(1):441-52. doi: 10.1128/AEM.02483-14. Epub 2014 Oct 31. Appl Environ Microbiol. 2015. PMID: 25362060 Free PMC article.
-
Diverse and dynamic populations of cyanobacterial podoviruses in the Chesapeake Bay unveiled through DNA polymerase gene sequences.Environ Microbiol. 2009 Nov;11(11):2884-92. doi: 10.1111/j.1462-2920.2009.02033.x. Epub 2009 Aug 24. Environ Microbiol. 2009. PMID: 19703219
-
Picocyanobacterial Synechococcus in marine ecosystem: Insights from genetic diversity, global distribution, and potential function.Mar Environ Res. 2022 May;177:105622. doi: 10.1016/j.marenvres.2022.105622. Epub 2022 Apr 9. Mar Environ Res. 2022. PMID: 35429822 Review.
-
Non-viral predators of marine picocyanobacteria.Trends Microbiol. 2025 May;33(5):558-568. doi: 10.1016/j.tim.2024.11.010. Epub 2024 Dec 20. Trends Microbiol. 2025. PMID: 39709274 Review.
Cited by
-
Spatial patterns in phage-Rhizobium coevolutionary interactions across regions of common bean domestication.ISME J. 2021 Jul;15(7):2092-2106. doi: 10.1038/s41396-021-00907-z. Epub 2021 Feb 8. ISME J. 2021. PMID: 33558688 Free PMC article.
-
Quantification of Marine Picocyanobacteria on Water Column Particles and in Sediments Using Real-Time PCR Reveals Their Role in Carbon Export.mSphere. 2022 Dec 21;7(6):e0049922. doi: 10.1128/msphere.00499-22. Epub 2022 Dec 6. mSphere. 2022. PMID: 36472446 Free PMC article.
-
Proliferative and viability effects of two cyanophages on freshwater bloom-forming species Microcystis aeruginosa and Raphidiopsis raciborskii vary between strains.Sci Rep. 2025 Jan 24;15(1):3152. doi: 10.1038/s41598-025-87626-z. Sci Rep. 2025. PMID: 39856188 Free PMC article.
References
Publication types
MeSH terms
Substances
LinkOut - more resources
Full Text Sources
Other Literature Sources
