. 2018 Jul 2;150(7):949-968.
doi: 10.1085/jgp.201711868. Epub 2018 Jun 18.

Molecular determination of claudin-15 organization and channel selectivity

Affiliations

Molecular determination of claudin-15 organization and channel selectivity

Priyanka Samanta et al. J Gen Physiol. .

Abstract

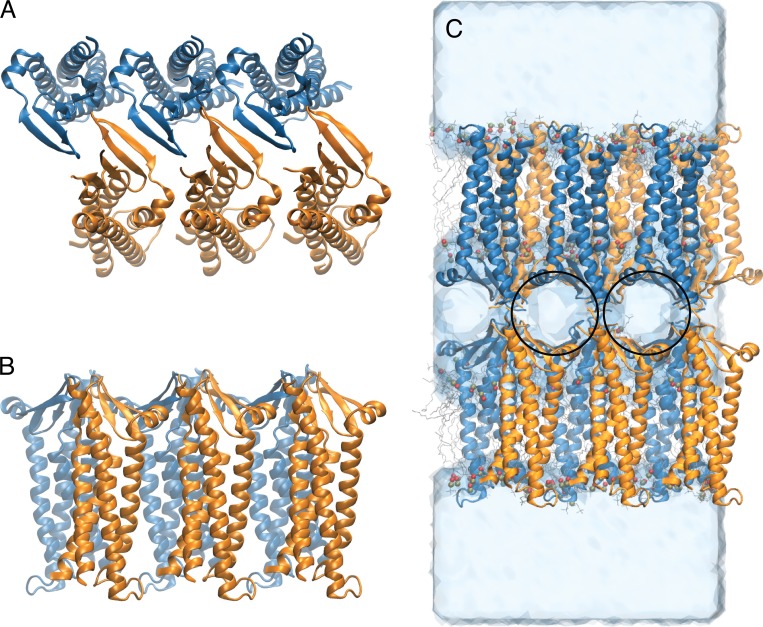
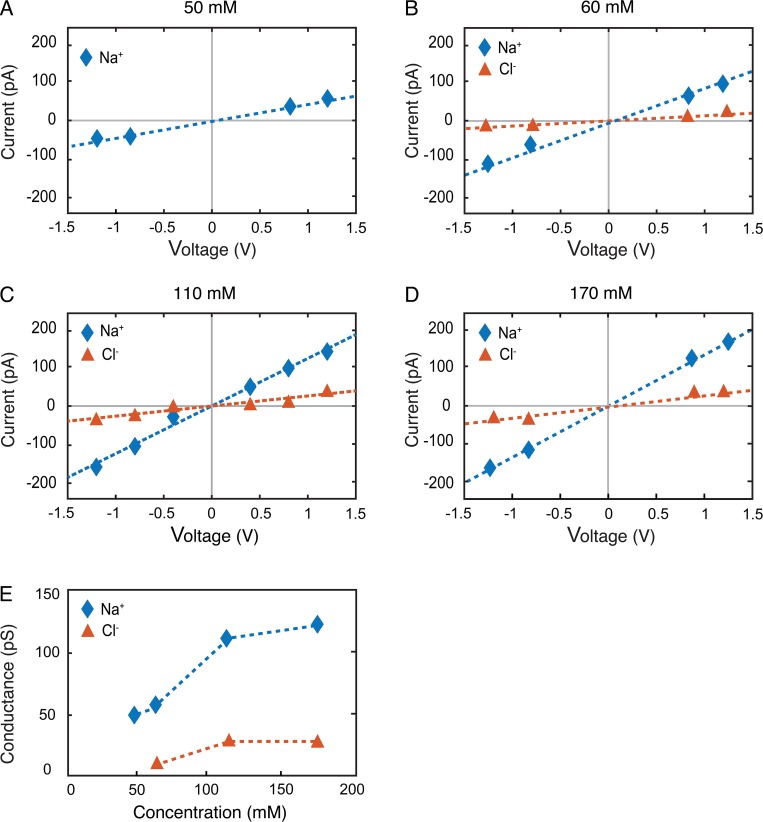
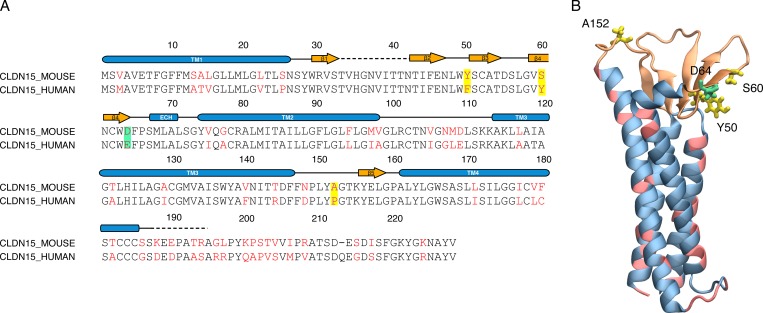
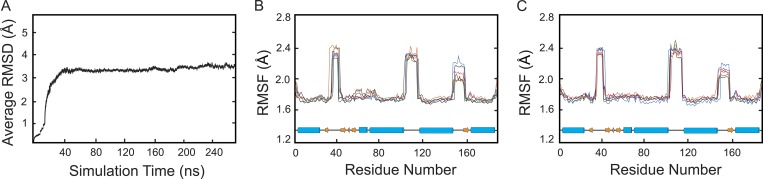
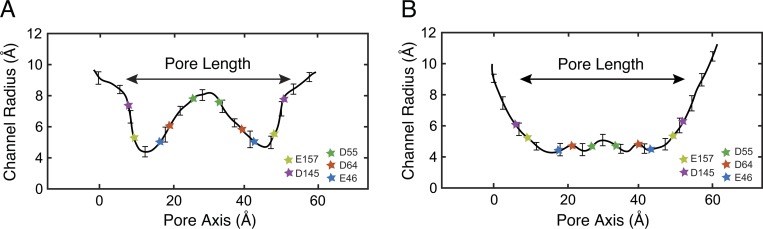
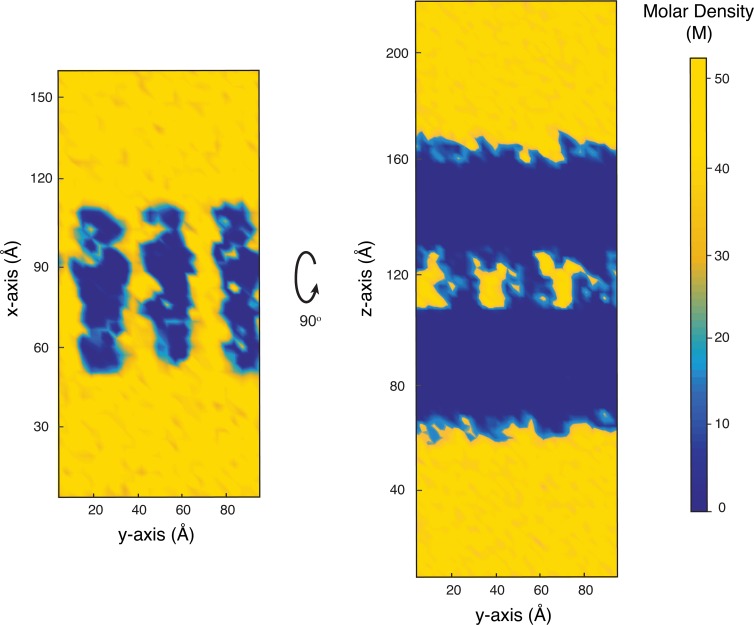
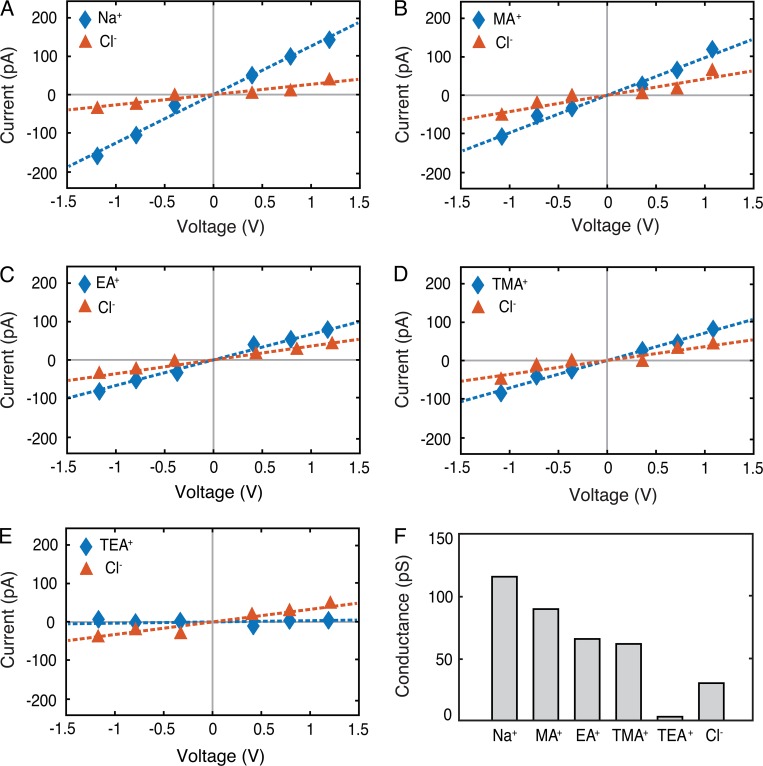
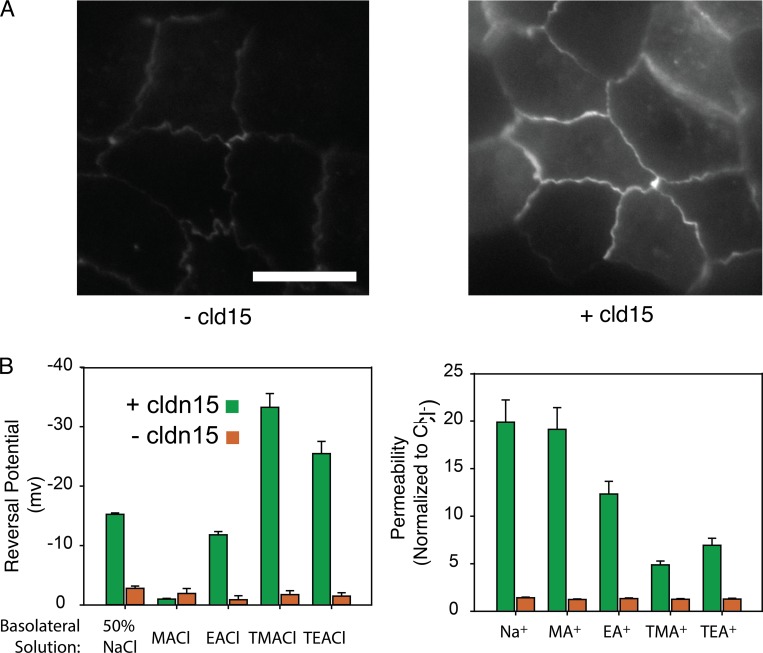
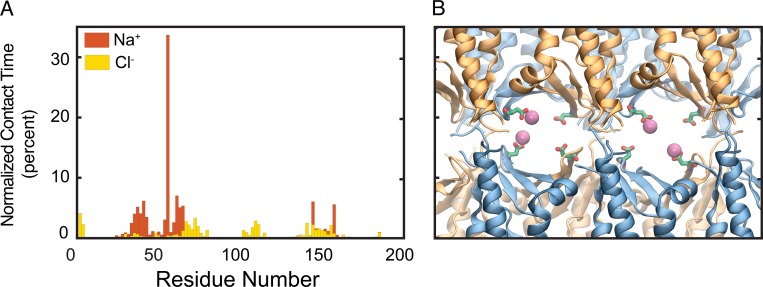
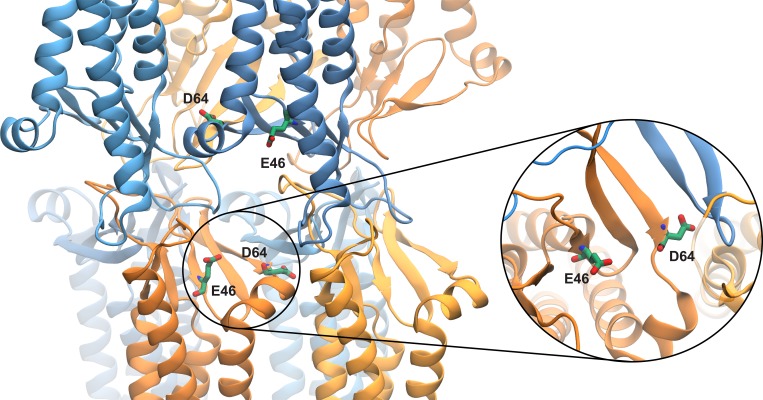
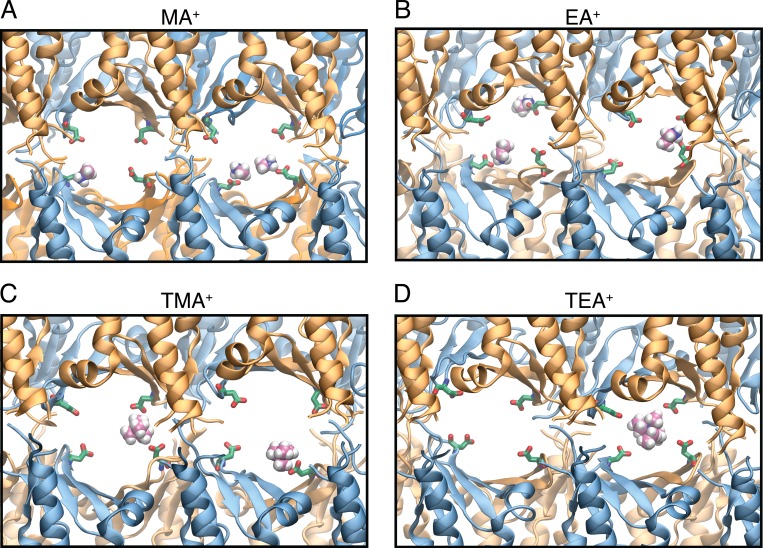
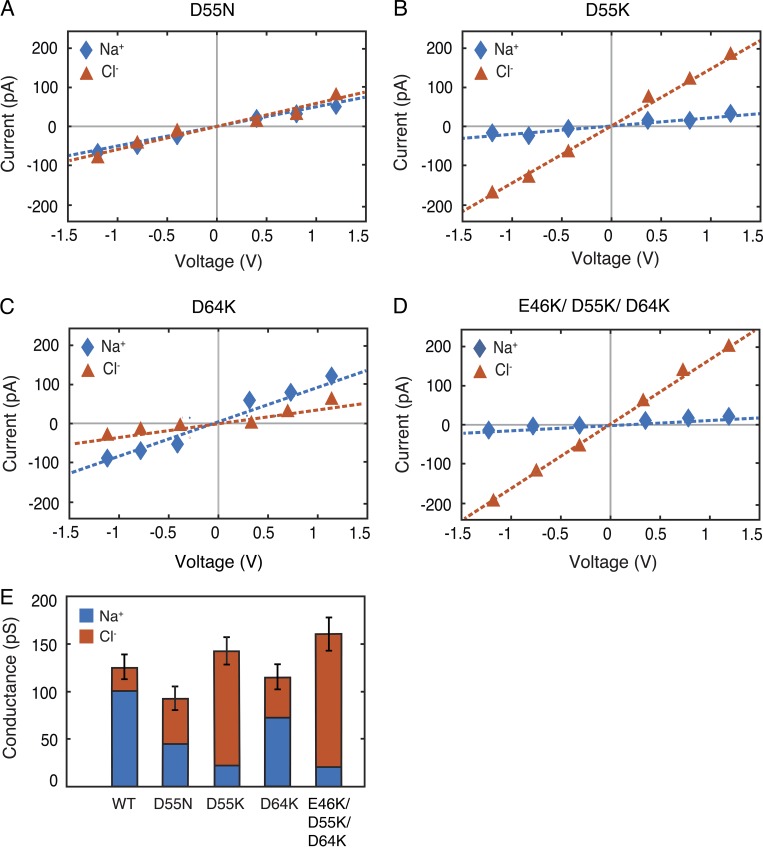
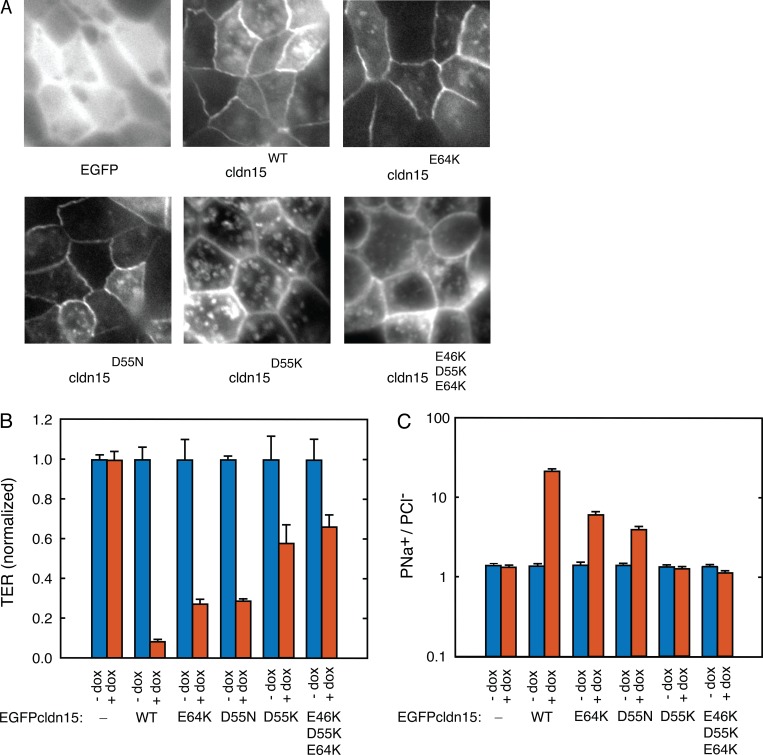
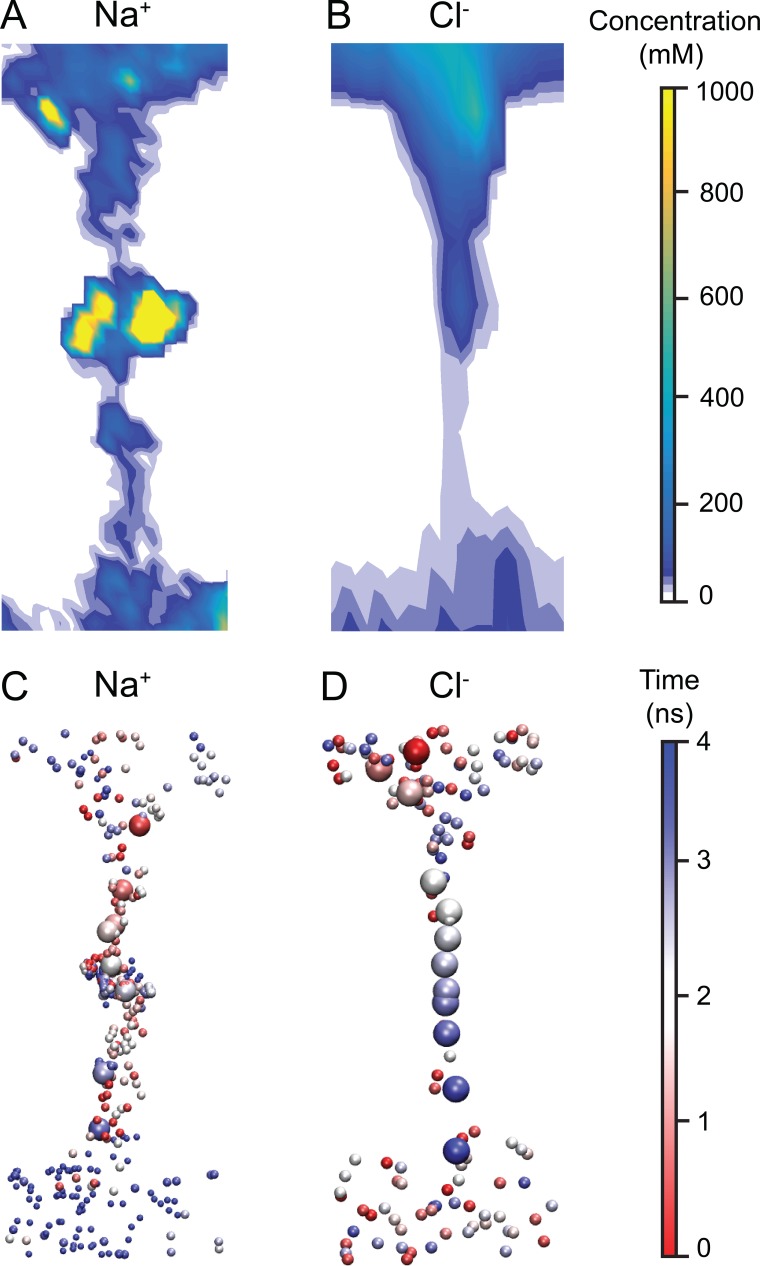
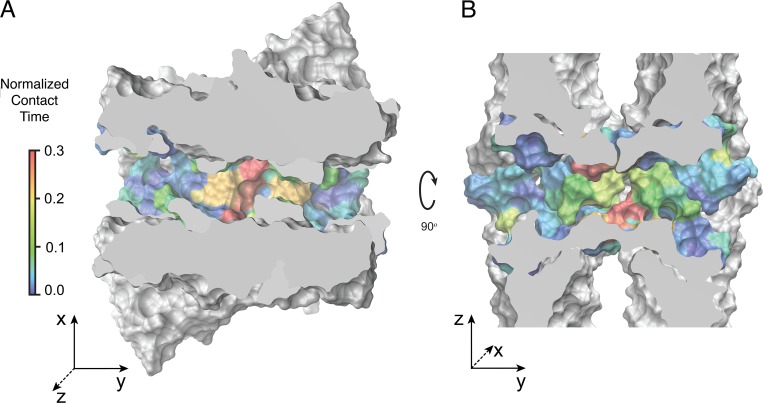
Tight junctions are macromolecular structures that traverse the space between adjacent cells in epithelia and endothelia. Members of the claudin family are known to determine tight junction permeability in a charge- and size-selective manner. Here, we use molecular dynamics simulations to build and refine an atomic model of claudin-15 channels and study its transport properties. Our simulations indicate that claudin-15 forms well-defined channels for ions and molecules and otherwise "seals" the paracellular space through hydrophobic interactions. Ionic currents, calculated from simulation trajectories of wild-type as well as mutant channels, reflect in vitro measurements. The simulations suggest that the selectivity filter is formed by a cage of four aspartic acid residues (D55), contributed by four claudin-15 molecules, which creates a negative electrostatic potential to favor cation flux over anion flux. Charge reversal or charge ablation mutations of D55 significantly reduce cation permeability in silico and in vitro, whereas mutations of other negatively charged pore amino acid residues have a significantly smaller impact on channel permeability and selectivity. The simulations also indicate that water and small ions can pass through the channel, but larger cations, such as tetramethylammonium, do not traverse the pore. Thus, our model provides an atomic view of claudin channels, their transport function, and a potential three-dimensional organization of its selectivity filter.


Figures

Figure 1.
Figure 1.
Claudin-15 monomers assemble into double-row strands and form paracellular channels. (A) Top view of the model of six claudin-15 molecules. The two rows are colored orange and blue. (B) Side view of the model. (C) Snapshot of the simulation system consisting of two parallel lipid membranes and claudin pores after equilibration. In this conformation, the claudins form paracellular channels shown with black circles.
Figure 2.
Figure 2.
Claudin-15 channel conductance is saturated within the physiological range of Na+ and Cl. (A–D) I-V plots are calculated with 50 mM of Na+ and no Cl (A), neutralized with 24 TEA+ and 60 mM NaCl (B), 110 mM NaCl (C), or 170 mM NaCl (D). (E) Conductance of the Na+ ions for the WT channel for the four systems above.
Figure 3.
Figure 3.
Human and mouse claudin-15 are similar. (A) Sequence alignment of mouse claudin-15 and human claudin-15. Identical residues are shown in black and nonidentical residues in red. The residues highlighted in the sequence lie in the extracellular region of claudin-15 monomer. (B) A snapshot of mouse claudin-15 monomer showing the nonidentical residues in the extracellular region (Y50, S60, and A152) in licorice and in the backbone of the helices in pink.
Figure 4.
Figure 4.
Claudin-15 pore stability. (A) RMSD of the protein backbone with respect to the initial model of claudin pores in the membrane over the equilibration trajectory. Rigid body movement of the entire system is removed before calculating the RMSD at each frame. (B and C) RMSF of the protein residues over the last 50 ns of equilibrium trajectory for each claudin monomer. The RMSF values of six claudin monomers in each layer are shown separately in B and C.
Figure 5.
Figure 5.
Cis-interactions between claudin monomers. Snapshot of three claudins monomers after 135 ns of equilibration in the double-bilayer system shows interactions between S67 of ECH and E157 of a neighboring claudin. E157 located at the interface of two monomers is hydrated and interacts with permeating cations. The cis-interactions observed in the crystal structure of claudin-15 (Suzuki et al., 2014) between M68 on ECH and the hydrophobic pocket of a neighboring claudin formed by F146, F147, and M158 of neighboring claudins are maintained throughout the simulation.
Figure 6.
Figure 6.
The double-row arrangement of claudins in the membrane remains stable through hydrogen bonds between β-sheets of adjacent claudins. (A–C) The number of hydrogen bonds between β-sheets of adjacent claudin-15 monomers in the lipid membrane remains stable over the course of the simulation. (D) Snapshot of the model showing the hydrogen bonds between β-sheets of adjacent claudin-15 monomers. Simulation unit cell contains six monomers in each membrane and three interfaces forming between claudin pairs marked with A, B, and C.
Figure 7.
Figure 7.
Trans-interactions between ECS2 loops. (A) Conformation of ECS2 loops after 135 ns of equilibration is shown for two claudin monomers. L150 and P149 of two opposing monomers interact with each other throughout the simulations. (B) Snapshots of the ECS2 before (red) and after (blue) equilibration are compared the crystal structure (orange). The initial model of Suzuki et al. (2015) did not include the ECS2 loop because of possible clashes between the two claudin rows. The conformation of ECS2 loop in red corresponds to our initial model of claudin pores, in which partial clashes or entanglement of the loops were removed through MD simulations. After removing the rigid body movement of TM3 and β5 (selection shown here), the equilibrated structure of ECS2 (blue) matches that of the crystal structure (orange), indicating that a tilting of TM helices in the claudin pore model will remove potential clashes in the initial model (Suzuki et al., 2015). The salt bridge between the side chain of K155 and backbone of N148 in ECS2 is maintained throughout the simulation (∼60% of the time), conferring relative rigidity to the ECS2 loops.
Figure 8.
Figure 8.
Snapshot of the ECS1 loop forming the trans-interactions between claudin rows. (A) The protein backbone of six monomers in one lipid bilayer is shown in gray. The initial and final conformations of the extracellular loop (residues 34–43) between β1 and β2 are shown with thin and thick lines, respectively. The loops are colored in the same manner as Fig. 1 for the top and bottom monomers. (B and C) Side view of the trans-interactions between the loops between two claudin rows. The inset shows hydrogen bonds between hydrophobic residues 39 and 42 of two opposing loops that seal the paracellular space to water molecules.
Figure 9.
Figure 9.
The claudin-15 selectivity filter is near the center of the pore, where the channel is widest. The mean pore radius (±SD) from 250-ns simulation is plotted in two different dimensions along the pore axis. (A) Radius along the x axis. (B) Radius along the z axis.
Figure 10.
Figure 10.
Water density across paracellular space. The mean density of water molecules is calculated from the equilibration trajectories (∼250 ns) and is shown across two planes: a plane parallel to the two membranes crossing the pores in the middle (left) and a plane normal to the two membranes and crossing the pores in the middle (right). The plots show a complete seal of paracellular space to water molecules. Water molecules can only flow through the channels defined by claudin pores.
Figure 11.
Figure 11.
MD simulations show the paracellular claudin-15 channels are cation and size selective. (A–E) I-V curves were calculated for systems containing 110 mM solutions of NaCl (A), methylammonium chloride (MACl; B), ethylammonium chloride (EACl; C), tetramethylammonium chloride (TMACl; D), and tetraethylammonium chloride (TEACl; E). Cationic and anionic currents are shown in blue and orange, respectively. (F) Conductance of the ions (Na+, MA+, TMA+, TEA+, and Cl) for the WT channel. Error bars represent SEM.
Figure 12.
Figure 12.
In vitro permeability measurements of WT claudin-15 demonstrate cation and size selectivity. (A) Doxycycline was used to express claudin-15 in MDCK I monolayers stably transfected with tetracycline-inducible EGFP-claudin-15 expression plasmid. Bar, 15 µm. (B) Permeability measurements demonstrate that induction of claudin-15 expression results in increased permeability to small monovalent cations. Error bars represent SEM.
Figure 13.
Figure 13.
Negatively charged residue D55 interacts strongly with Na+ ions. (A) Normalized contact time (percent) of the Na+ and Cl ions with claudin-15 amino acid residues obtained from simulation trajectories. The ions are assumed to be in contact with the protein if they are within 4 Å of the heavy atoms of the protein. The peak at D55 represents a strong binding site for Na+ ions inside the claudin-15 pore. (B) Representative snapshot of claudin-15 pores from permeation trajectories in which Na+ ions (magenta) interact with D55 residues (green and red) inside the pore.
Figure 14.
Figure 14.
Snapshot of a claudin pore after 100 ns of equilibration showing the position of E46 and D64 near the entrance of the pore. The inset shows the top-view orientation of D64 at the interface of two claudins with its side chain parallel to the permeation pathway.
Figure 15.
Figure 15.
Claudin-15 D55 amino acid residues interact with monovalent cations. (A–D) Representative snapshots of claudin-15 pores from permeation trajectories show interactions with MA+ (A), EA+ (B), TMA+ (C), and TEA+ (D); carbon atoms are shown in pink, nitrogen in blue, and hydrogen in white. D55 amino acid residues are shown in green and red.
Figure 16.
Figure 16.
D55 is a key amino residue that defines claudin-15 cation selectivity. (A–D) I-V curves were calculated for systems containing 110-mM NaCl solutions for D55N (A), D55K (B), D64K (C), and triple mutation of E46K/D55K/D64K (D). The cationic and anionic currents are shown in blue and red, respectively. (E) Conductance of claudin-15 pores for Na+ and Cl ions obtained from simulation trajectories of the mutants and WT demonstrates the importance of D55. Error bars for the total conductance represent the statistical error in estimating the total conductance from finite number of permeation events.
Figure 17.
Figure 17.
D55 is a critical amino acid residue defining transepithelial resistance and ion selectivity for claudin-15 channels. (A) Doxycycline was used to express claudin-15 in MDCK I monolayers stably transfected with tetracycline-inducible EGFP-claudin-15 constructs with and without point mutations. Matched exposures are shown which reveal similar tight junction claudin-15 localization and expression. (B) TER expressed normalized to MDCK I monolayers that were not induced to express claudin-15. (C) Relative permeability of Na+ to Cl (PNa+/PCl) shows loss of cation selectivity with mutation of D55. Error bars represent SEM.
Figure 18.
Figure 18.
The claudin-15 pore favors permeation of Na+, but not Cl. (A and B) Density profile of Na+ and Cl ions along the permeation pathway of claudin-15 pore. (C and D) Permeation pathways of Na+ and Cl ions across the pore. The ions are shown in van der Waals representation and are colored by time step with red representing the beginning of their trajectory and blue representing the end. The trajectory of one Na+ and one Cl ion is highlighted (enlarged).
Figure 19.
Figure 19.
The selectivity filter, located near the center of the claudin-15 pore, has a high affinity for Na+ ions. (A and B) Cross sections of the claudin-15 pore across the planes parallel (A) or perpendicular (B) to the membrane. Protein surface is shown in van der Waals representation. The residues lining the pore are colored based on their contact time with permeating Na+ ions as shown in Fig. 13 A.

Comment in

  • Claudins get a closer look.
    Sedwick C. Sedwick C. J Gen Physiol. 2018 Jul 2;150(7):893. doi: 10.1085/jgp.201812136. Epub 2018 Jun 19. J Gen Physiol. 2018. PMID: 29921660 Free PMC article.

References

    1. Adelman J.L., and Grabe M.. 2015. Simulating Current-Voltage Relationships for a Narrow Ion Channel Using the Weighted Ensemble Method. J. Chem. Theory Comput. 11:1907–1918. 10.1021/ct501134s - DOI - PMC - PubMed
    1. Alberini G., Benfenati F., and Maragliano L.. 2017. A refined model of claudin-15 tight junction paracellular architecture by molecular dynamics simulations. PLoS One. 12:e0184190 10.1371/journal.pone.0184190 - DOI - PMC - PubMed
    1. Amasheh S., Meiri N., Gitter A.H., Schöneberg T., Mankertz J., Schulzke J.D., and Fromm M.. 2002. Claudin-2 expression induces cation-selective channels in tight junctions of epithelial cells. J. Cell Sci. 115:4969–4976. 10.1242/jcs.00165 - DOI - PubMed
    1. Anderson J.M., and Van Itallie C.M.. 2009. Physiology and function of the tight junction. Cold Spring Harb. Perspect. Biol. 1:a002584 10.1101/cshperspect.a002584 - DOI - PMC - PubMed
    1. Angelow S., and Yu A.S.. 2009. Structure-function studies of claudin extracellular domains by cysteine-scanning mutagenesis. J. Biol. Chem. 284:29205–29217. 10.1074/jbc.M109.043752 - DOI - PMC - PubMed

Publication types

Associated data

LinkOut - more resources